
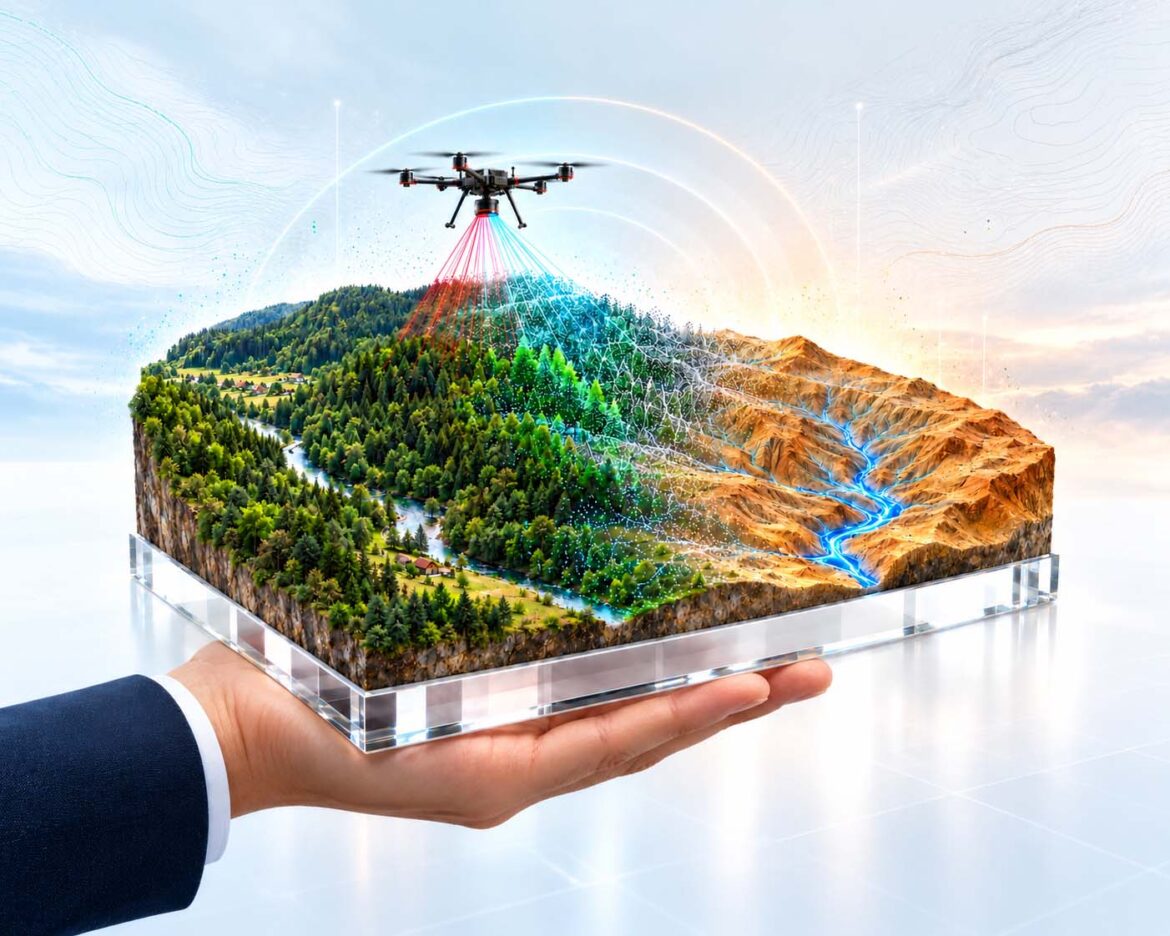
A forest disappears digitally, revealing the terrain on which planning takes place.
Visualization: Laser points and aerial images create a digital twin of the landscape on which decisions can be tested before they have consequences | Image: © Ulrich Buckenlei | XR Stager Online Magazine | VISORIC GmbH
A forested mountain, a small town by a river, fields with drainage ditches. Then the forest disappears, tree by tree, leaving a bare relief with fine blue lines showing where rainwater flows. This is what a video looks like that sparked a lively expert discussion on LinkedIn in October 2026. It shows the evaluation of a drone survey in southern Brazil, in which, according to the surveying firm that carried it out, a laser scanner captured around 1.7 billion measurements.
The video shows an established measurement technology made newly accessible, with no special effects involved. What used to require survey aircraft and large budgets is now done by a drone in just a few flights. That is exactly what makes the example instructive. It raises a question that matters equally to developers, infrastructure operators, industry and the real estate sector: What becomes possible when a landscape can be captured so precisely that planning, simulation and communication take place on the same digital representation?
The discussion below the post captured the answer. Several voices from industry and technology emphasized that the real value lies in testing assumptions about terrain and drainage while changing the plan is still inexpensive, far more than in removing the trees. Another contribution added the fourth dimension: repeated scans could show how forests grow, riverbeds shift or construction sites evolve.
For project developers, planning departments, site managers and innovation teams, this is an investment question. Anyone who has terrain, buildings or facilities captured digitally today should know which technology delivers which information, how accurate it is and how measurement data becomes a tool for decisions. This article examines the development step by step: from laser physics through classification and terrain models to Gaussian Splatting, simulation, change analysis, discovery and responsibility. It also shows what an entry looks like that starts small and delivers reliable results.
- A drone now captures terrain at survey quality.
- LiDAR sees through gaps in the canopy down to the ground.
- Gaussian Splatting delivers the photorealistic image of the surface.
- The value comes from simulation before the decision.
- It all starts with a clearly defined pilot.
The following article shows how laser pulses find their way through the forest, how points gain meaning, what Gaussian Splatting adds, how simulation and time multiply the benefit and how a survey becomes a responsible digital twin.
A forest digitally loses its trees
The video opens with a view of a point cloud. Red lines fan out from above, the laser beams of a drone, striking a field of millions of white points. Then the views change: a color aerial image with mountain, town and fields, a representation in which vegetation, buildings and ground are colored differently, an ochre relief without any vegetation, an elevation model with drawn runoff lines and finally a finished map with roads, buildings and property boundaries.[1]
According to the description by the surveying firm, the terrain was captured with a DJI Matrice 400 drone and the Zenmuse L3 LiDAR sensor. LiDAR stands for Light Detection and Ranging, meaning distance measurement with light. The measurements produced six results: a point cloud, a classification of the points, a digital terrain model, a simulation of surface runoff, an orthomosaic, which is a true-to-scale composite aerial image, and a vectorized map for engineering projects.[1]
What is remarkable is less each individual result than their sequence. Each view answers a different question. The point cloud shows what was measured. The classification shows what the points mean. The terrain model shows how the ground actually runs. The runoff simulation shows what happens when it rains. And the map makes all of this usable for planners, authorities and developers. This very chain, from measurement to decision, is the real subject of the video.
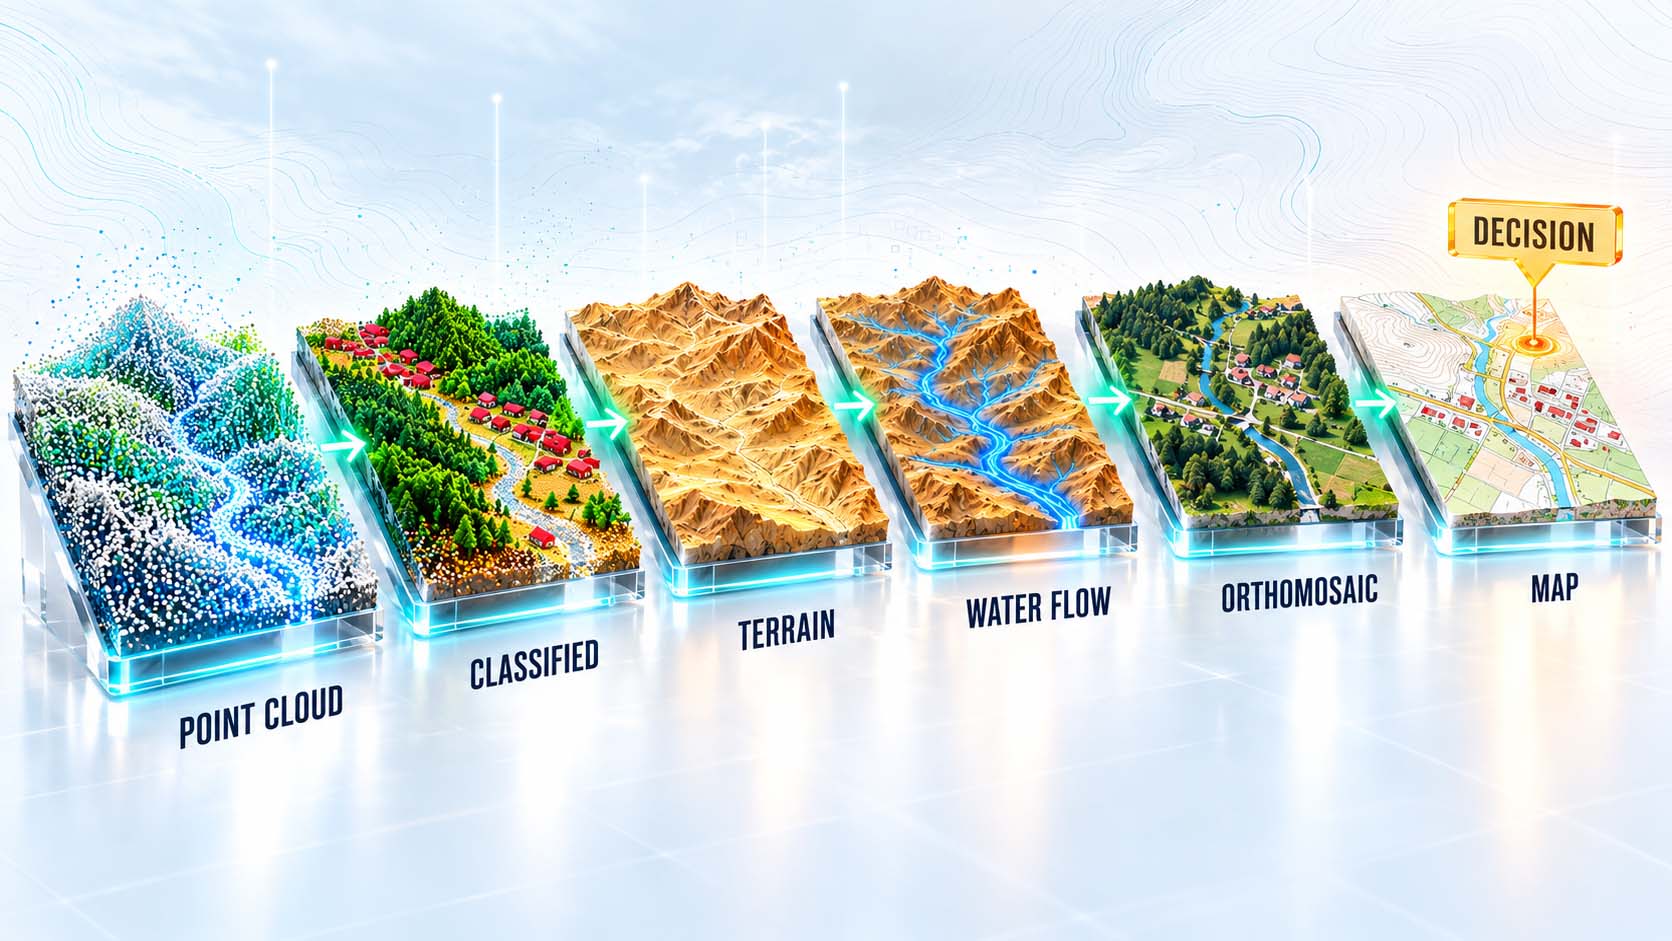
Each view answers a different question.
Infographic: Only the chain from measurement through meaning and simulation to the map turns laser points into a basis for decisions | Graphic: © Ulrich Buckenlei | XR Stager Online Magazine | VISORIC GmbH
Putting this in context requires a correction. The video description speaks of millimeter-accurate capture. The manufacturer specifies the system accuracy of the sensor at a flight altitude of 120 meters as around four centimeters horizontally and three centimeters vertically, determined under laboratory conditions with a reference station and post-processing.[2] That is excellent for planning and surveying, but it is centimeters. Anyone using measurement data for decisions should know this order of magnitude, because it determines which questions a model can answer. Centimeters are sufficient for the position of a road, the slope of a plot or the volume of earthworks. They are not sufficient for the fit of a machine component.
For companies, the example shows how far the threshold for precise terrain capture has shifted. A drone with a laser scanner is now a standard tool of modern surveying firms. What matters is no longer access to the technology but the question of which information is needed for which project and how it must be prepared so that specialist departments, management and permitting authorities can work with it. The next chapter shows how the laser sees through the forest in the first place.
- The video shows a real drone survey in Brazil.
- The measurements produce six results that build on each other.
- Each view answers a different planning question.
- Accuracy is in the centimeter range, not millimeters.
- The bottleneck is processing, no longer access to the technology.
A forest that disappears digitally is therefore the visible result of a complete measurement chain, far more than an effect.
How laser pulses find their way through the canopy
A LiDAR sensor emits short laser pulses and measures how long the light takes to reach a surface and return. This travel time yields the distance. Combined with the exact position of the drone from satellite navigation and its orientation in space from inertial sensors, meaning acceleration and rotation rate sensors, each returning pulse becomes a point with coordinates. Millions of such points per second form a point cloud.
According to the manufacturer, the sensor in the video operates at a wavelength of 1535 nanometers and pulse rates between 100,000 and two million pulses per second.[2] Another property is decisive for seeing through the forest: a single pulse can produce several echoes. Part of the light is reflected by the tree crown, part by branches at medium height, and part finds its way through small gaps in the canopy down to the ground. Depending on settings, the Zenmuse L3 records up to 16 such returns per pulse.[2]
These multiple echoes are the reason LiDAR reveals terrain under vegetation that appears in no photo. A camera sees only the topmost surface, the canopy. A laser scanner, by contrast, collects measurement points from all levels, and the last returns of a pulse often come from the ground. The denser the vegetation, the fewer pulses reach it, but with sufficient point density just a few ground points per square meter are enough to reliably reconstruct the course of the terrain.
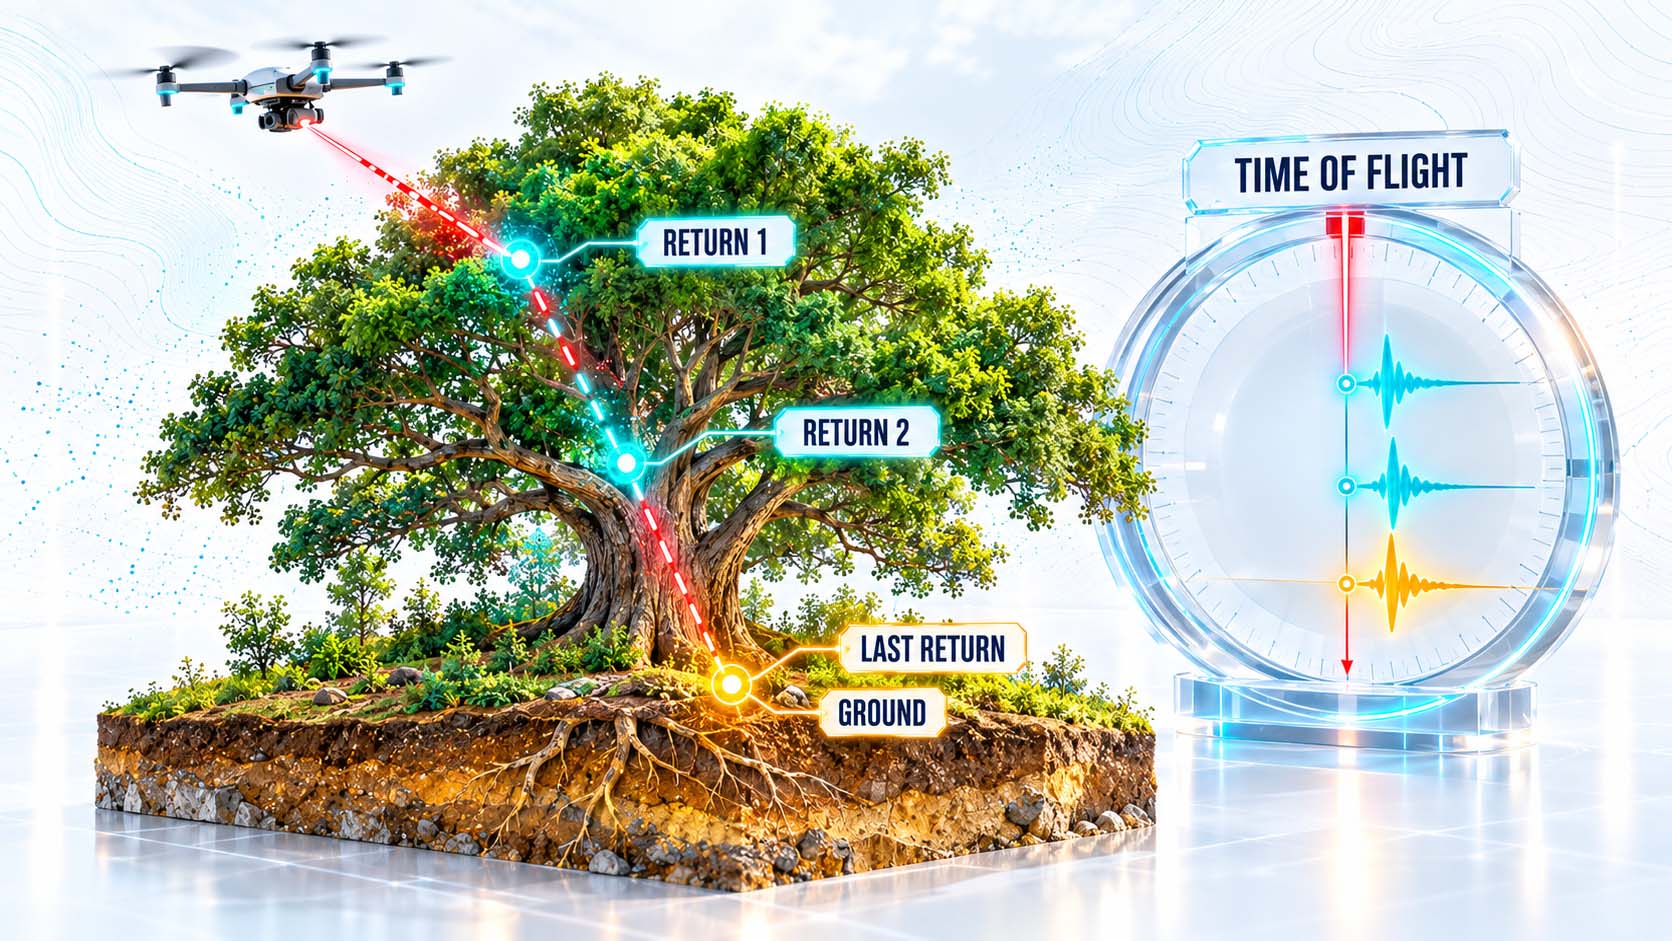
One pulse, several echoes, and the last one often reaches the ground.
Infographic: Multiple echoes make the difference between a photo of the canopy and a measurement of the terrain beneath it | Graphic: © Ulrich Buckenlei | XR Stager Online Magazine | VISORIC GmbH
How dense and accurate a capture must be is standardized in the profession. The U.S. Geological Survey, USGS, defines quality levels for its national elevation program. The highest level requires at least eight points per square meter and a vertical accuracy of five centimeters, the common level for national surveys two points per square meter and ten centimeters.[3] At low flight altitudes, drones often achieve many times this density because they fly closer to the ground than aircraft. In return, they cover much smaller areas per flight.
For companies, this means that choosing between aircraft, drone and terrestrial scanner is a question of area, level of detail and purpose. For a plot, a plant site, a route corridor or a construction site, the drone is usually the most efficient tool. In practice, flight planning determines quality: flight altitude, overlap of the flight lines, pulse rate and ground reference points. The next chapter shows how the points become a statement about the terrain.
- LiDAR measures distances via the travel time of laser pulses.
- A single pulse can produce up to 16 returns.
- The last returns often come from the ground beneath the forest.
- USGS defines quality levels for point density and accuracy.
- Flight planning determines the quality of the capture.
Seeing through the forest is therefore statistics rather than an X-ray: many pulses, enough of which reach the ground.
From measurement point to meaning
A point cloud initially contains only coordinates and a few measured values such as the strength of the returning signal. It does not know whether a point belongs to a tree, a roof or a road. This meaning only emerges through classification. Software assigns each point to a class based on height, neighborhood, shape and signal strength.
There is an international standard for these classes. The LAS file format of the American Society for Photogrammetry and Remote Sensing, ASPRS for short, defines class codes including ground, low, medium and high vegetation, building, water, rail and road surface.[4] In the video, these classes appear as colored areas: green for vegetation, red for buildings, ochre for ground. Because all programs use the same code for ground, data can be exchanged between surveying firm, planning office and authority without losing its meaning.
The ground points form the digital terrain model, DTM for short. It describes the earth’s surface without vegetation and buildings. It differs from the digital surface model, which shows the topmost surface including trees and roofs. The difference between the two models yields the height of vegetation and buildings, an important value for forestry, urban planning and shading analyses.
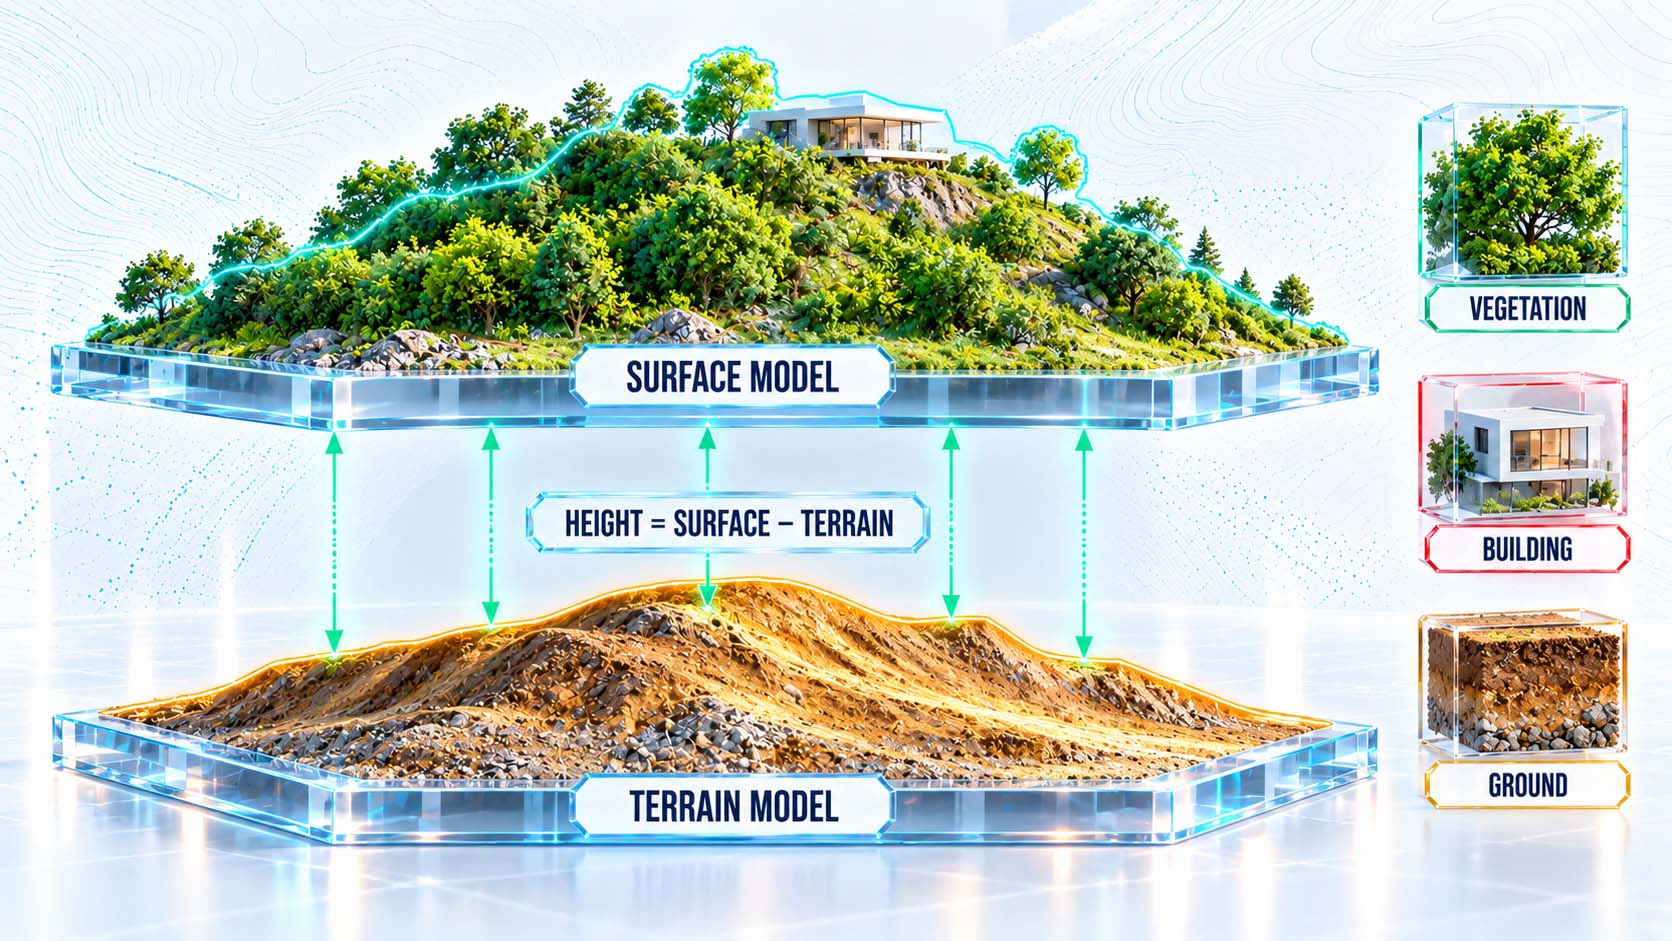
Only the class turns a point into a statement.
Infographic: Classification separates ground, vegetation and buildings, and the difference between surface and terrain creates new information | Graphic: © Ulrich Buckenlei | XR Stager Online Magazine | VISORIC GmbH
For companies, classification is the step where quality is decided. Automatic methods now do most of the work, but at transitions, such as low vegetation on slopes, bridges or buildings with green roofs, review and rework are needed. A misclassified bush can appear as a bump in the terrain model and distort a runoff calculation. That is why every delivery should state which classes were checked automatically and which manually. It is also worth looking at the point density on the ground: in dense forest it can locally be so low that the terrain there is interpolated rather than measured.
A cleanly classified dataset is therefore more than an intermediate result. It is the shared foundation on which terrain analysis, planning, visualization and simulation build. The next chapter shows what a photorealistic representation of the surface adds.
- A point cloud initially knows only coordinates.
- The ASPRS standard defines classes such as ground and building.
- The terrain model shows the ground without vegetation and buildings.
- Surface minus terrain yields vegetation and building height.
- Classification needs review at critical transitions.
Classification thus turns measurement points into meaning, and only meaning makes data exchangeable between disciplines.
Gaussian Splatting shows visible reality
LiDAR measures geometry, even beneath the canopy. Since 2023, another method has become established for the photorealistic representation of what a person sees on site: 3D Gaussian Splatting. Researchers from the French research institute Inria and the Max Planck Institute for Informatics presented it at SIGGRAPH 2023.[5] The method describes a scene with millions of small, semi-transparent color clouds, so-called Gaussian ellipsoids, instead of triangular surfaces. Each has a position, shape, color and transparency.
The starting point is ordinary photos from many angles, for example from a drone flight. From these, an optimization process calculates the clouds so that together they reproduce the photos as accurately as possible from every perspective. According to the authors, the result can be displayed in real time at at least 30 frames per second in Full HD resolution.[5] Reflections, fine structures such as railings or vegetation and soft transitions therefore look much more natural than in classic textured 3D models.
The two methods complement each other. LiDAR delivers reliable geometry and sees through vegetation. Gaussian Splatting delivers the visible appearance, what project stakeholders, investors or residents understand intuitively. Photogrammetry, the classic reconstruction from photos, sits in between and produces textured surface models. The overview below the graphic classifies the three methods.
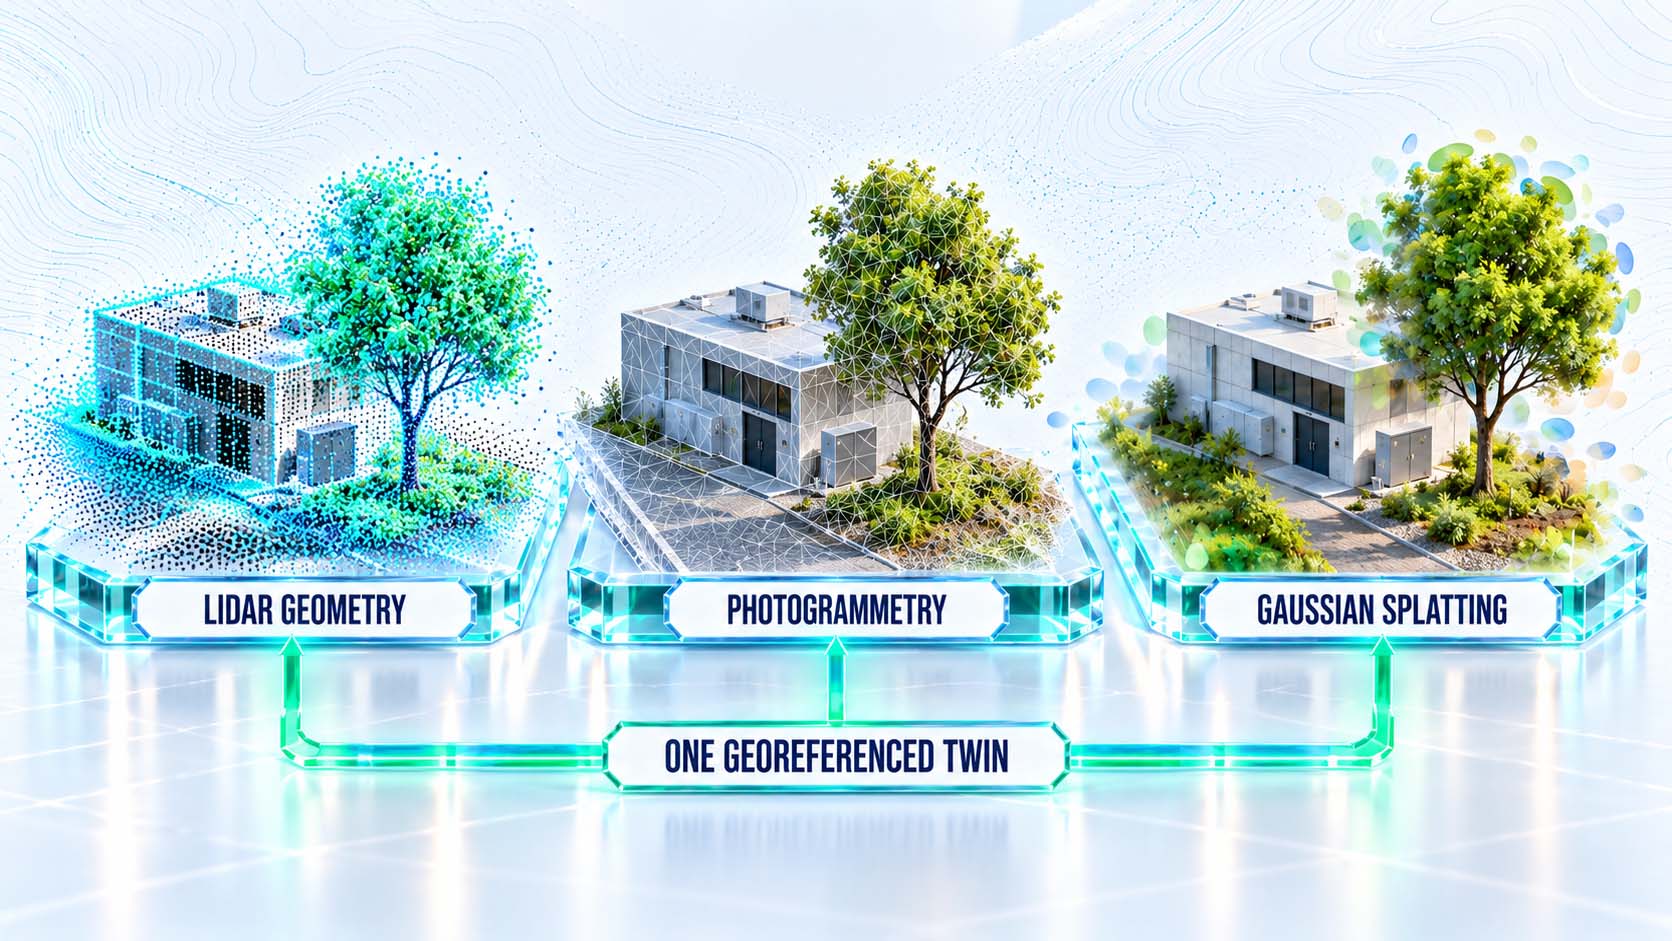
Geometry, surface and appearance complement each other.
Infographic: LiDAR secures the geometry, Gaussian Splatting the clarity, and georeferenced together they form a complete digital twin | Graphic: © Ulrich Buckenlei | XR Stager Online Magazine | VISORIC GmbH
| Method | Delivers | Under vegetation | Typical purpose |
|---|---|---|---|
| LiDAR | Measured geometry as a point cloud | Yes, via multiple echoes | Terrain model, surveying, volume |
| Photogrammetry | Textured surface models and orthomosaic | No, visible surface only | Maps, as-built models, documentation |
| Gaussian Splatting | Photorealistic real-time representation | No, visible surface only | Communication, walkthrough, presentation |
| Combination | Geometry and appearance in one reference system | Yes, via the LiDAR component | Digital twin for planning and operations |
Overview: Three capture methods compared, own classification based on the cited sources | Table: © Ulrich Buckenlei | XR Stager Online Magazine | VISORIC GmbH
Standardization shows how quickly Gaussian Splatting is finding its way into professional applications. In February 2026, the Khronos Group, which is responsible for the 3D exchange format glTF among others, presented an extension for Gaussian splats as a release candidate. Participants include Autodesk, Bentley Systems with Cesium, Esri and NVIDIA.[6] At INTERGEO 2026 in Munich, Esri also showed a georeferenced Gaussian Splatting dataset of the entire Netherlands, which is to be updated annually.[7] A research method is thus becoming an exchangeable data format for geoinformation.
For companies, the combination is the real gain. A Gaussian Splatting model alone is no survey, and a point cloud alone convinces no investor. When both are georeferenced in the same coordinate system, a site can be explored photorealistically and measured at the same time. In practice, capture planning is decisive: lighting conditions, flight paths, viewing angles and overlap determine how complete and sharp the result will be. The next chapter shows how this representation becomes a tool for decisions.
- Gaussian Splatting describes scenes with millions of color clouds.
- The starting point is photos from many angles, for example by drone.
- The representation runs in real time and looks photorealistic.
- Khronos is standardizing Gaussian splats in the glTF format.
- LiDAR and splatting together deliver geometry and appearance.
Gaussian Splatting thus makes the measured world understandable, and LiDAR ensures that what is understandable is also correct.
Simulate before the landscape is changed
One idea came up again and again in the discussion of the video: the value of a terrain model shows before construction begins. A comment from industry put it precisely. The data allows engineers to test assumptions about terrain and drainage while changing the plan is still significantly cheaper. Another contribution named the decisions that benefit: drainage, the location of infrastructure and environmental impact, before resources are committed.
The video shows one of these applications. Surface runoff is simulated from the terrain model: Where does rainwater flow, where does it collect, where do the watersheds run, the boundaries between catchment areas? The blue lines on the relief are the result. For a developer, this means recognizing at the planning stage whether a construction site lies in a natural runoff channel, whether a stormwater retention basin is planned in the right place or whether a new road interrupts a waterway.
The European legal framework shows how important such analyses are. The European Union’s Floods Directive obliges member states to prepare and regularly update flood hazard and flood risk maps.[8] High-resolution terrain models are the basis for this. For individual sites, plants or construction areas, a drone capture can supplement this basis at a much higher resolution than nationwide data provides.
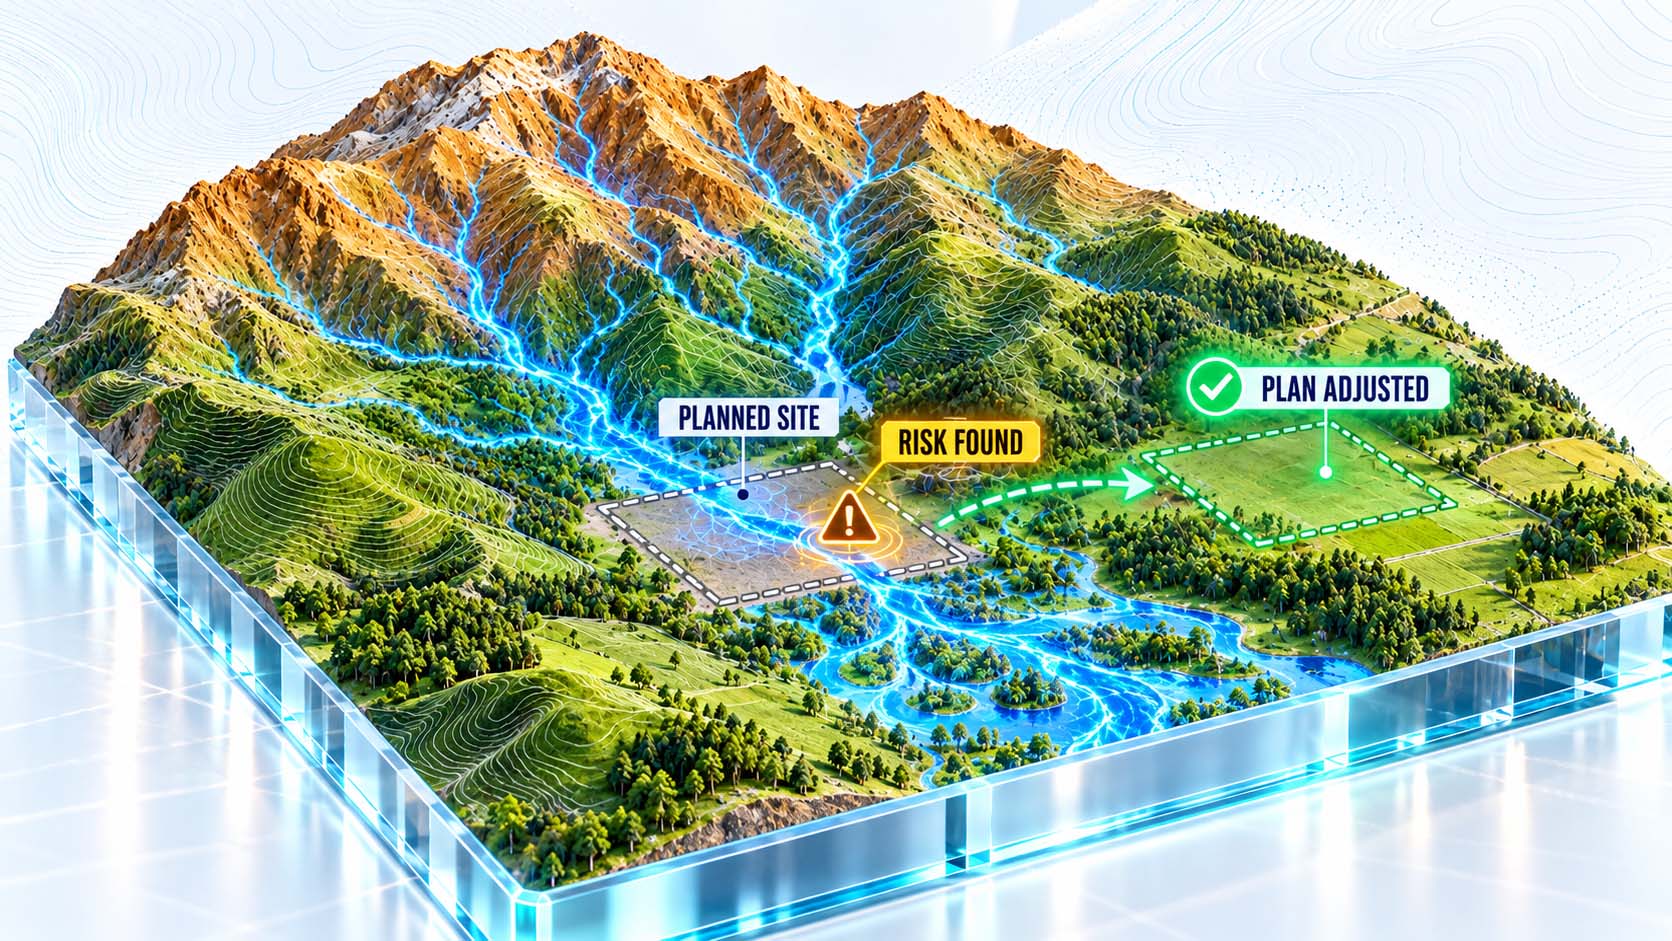
The cheapest moment for a change is before the first ground is broken.
Infographic: A terrain model reveals risks while the plan can still be adjusted with little effort | Graphic: © Ulrich Buckenlei | XR Stager Online Magazine | VISORIC GmbH
For companies, the benefit extends far beyond flooding. The same model can be used to calculate earth volumes for excavations and grading, check gradients for access roads and pipelines, assess sight lines and shading or estimate noise propagation. For plant sites and logistics areas, expansions thus become assessable before expert reports are commissioned or land is purchased. Another contribution to the discussion brought in the environmental aspect: erosion risks, flooding scenarios and interventions in the landscape can be tested digitally before the real landscape is changed.
It is essential that simulations remain labeled as simulations. A runoff calculation depends on assumptions about precipitation, soil and infiltration. It does not replace a hydrological report, but it shows where a report is needed. It is most effective when planners, authorities and residents see the result together, for example in a spatial representation in the browser. The next chapter shows what additional dimension measurement data gains when it is repeated.
- The value of a terrain model shows before construction.
- Runoff simulations show waterways and watersheds.
- The EU requires flood hazard and risk maps.
- Earth volumes, gradients and shading can be checked in advance.
- Simulations remain assumptions and do not replace a report.
Simulation on an accurate terrain model thus shifts decisions to the point where they cost the least.
The fourth dimension is time
A single scan shows a state. The discussion of the video named the next step: adding time. Repeated LiDAR scans could show how forests grow, how riverbeds shift or how construction sites develop. A digital representation thus becomes a digital twin that makes change visible and measurable.
There are established methods for this. Comparing two point clouds of the same area from different points in time is called change analysis. A widely used algorithm for it is M3C2, developed by Dimitri Lague, Nicolas Brodu and Jérôme Leroux and published in 2013 in the ISPRS Journal of Photogrammetry and Remote Sensing.[9] It calculates distances between two point clouds along the local surface direction and provides a level of detection for each value. This makes it possible to tell whether a change has actually taken place or lies within the measurement uncertainty.
This level of detection is especially important for companies. If a model shows a subsidence of three centimeters but the measurement accuracy is three to four centimeters, the statement is not reliable. Reliable change analyses therefore require repeatable flight planning, stable ground reference points and documented processing. Only when two captures were created comparably is their difference information.
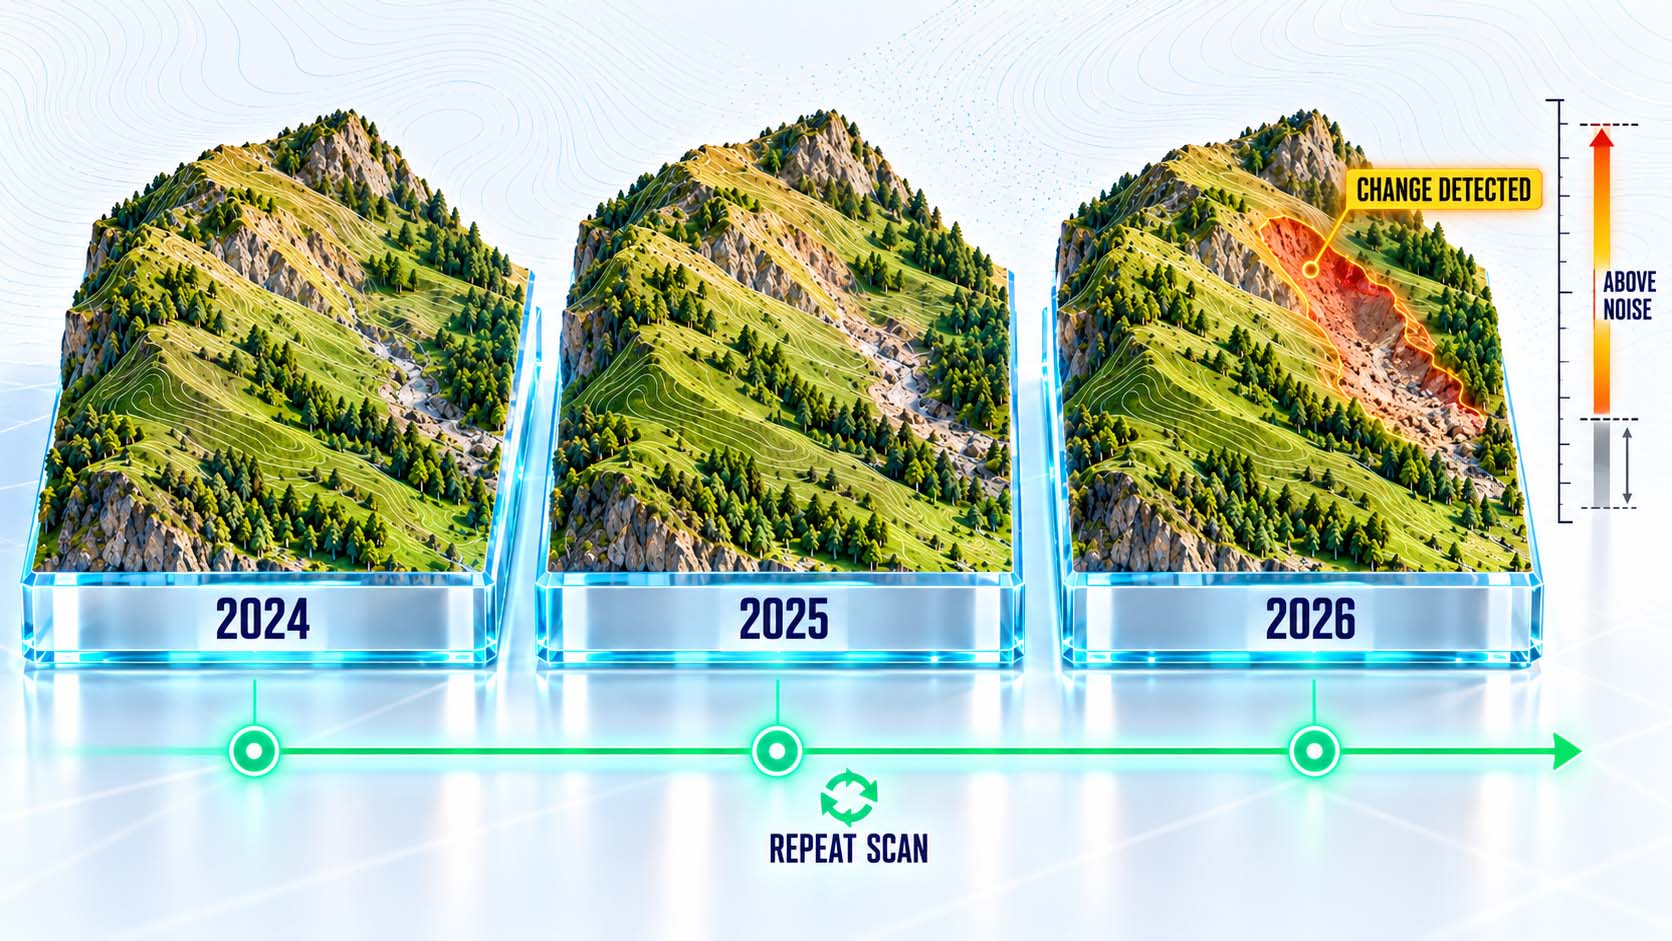
Only comparison turns snapshots into a development.
Infographic: Repeated captures show change, and it becomes reliable when it clearly exceeds the measurement uncertainty | Graphic: © Ulrich Buckenlei | XR Stager Online Magazine | VISORIC GmbH
The applications are diverse. On construction sites, repeated captures document construction progress and moved earth volumes. In open-pit mines and on stockpiles, volumes are recorded for billing and planning. On embankments, dikes and slopes, landslides and settlements become visible early. For forestry operations, time series show growth, damage and timber stock. And on plant sites, it can be traced whether the digital inventory still matches the real terrain. Gaussian Splatting adds a visual time series: project stakeholders see more than numbers, they see how the site looked at different points in time.
For companies, the time dimension also changes the question of effort. A one-time capture is a project, a repeated capture is a process. It requires defined intervals, consistent parameters, version-controlled storage and clear responsibility for who evaluates changes. The next chapter shows how laser data and artificial intelligence can even uncover the unknown.
- Repeated scans make change measurable.
- M3C2 compares point clouds with a level of detection.
- Changes below measurement accuracy are not reliable.
- Construction sites, stockpiles, slopes and forests benefit from time series.
- A project becomes a repeatable process.
With time as the fourth dimension, the digital twin of the landscape thus becomes an instrument that recognizes developments before they become a problem.
What lies hidden beneath the surface
A 2018 study in the journal Science showed how much can be hidden beneath vegetation. A research team led by Marcello Canuto and Francisco Estrada-Belli of Tulane University analyzed airborne LiDAR data covering more than 2,100 square kilometers in northern Guatemala. Beneath the rainforest, they identified 61,480 structures of the Maya civilization, including houses, palaces, ceremonial centers and pyramids, as well as terraces, fields and causeways.[10]
The study changed the picture of an entire civilization. The researchers estimated the population of the area in the Late Classic period at seven to eleven million people, significantly more than previously assumed.[10] Many of these structures were invisible from the air and barely recognizable on the ground in the dense forest. Only the terrain model without vegetation made the patterns visible: straight lines, right angles, regular mounds that do not occur in the natural landscape.
The discussion of the video took this idea further. One participant asked what secrets LiDAR might still reveal in other regions. The answer in the discussion pointed to the connection with artificial intelligence: algorithms that search large terrain models for conspicuous shapes can flag overlooked structures or geological features, which experts then examine.
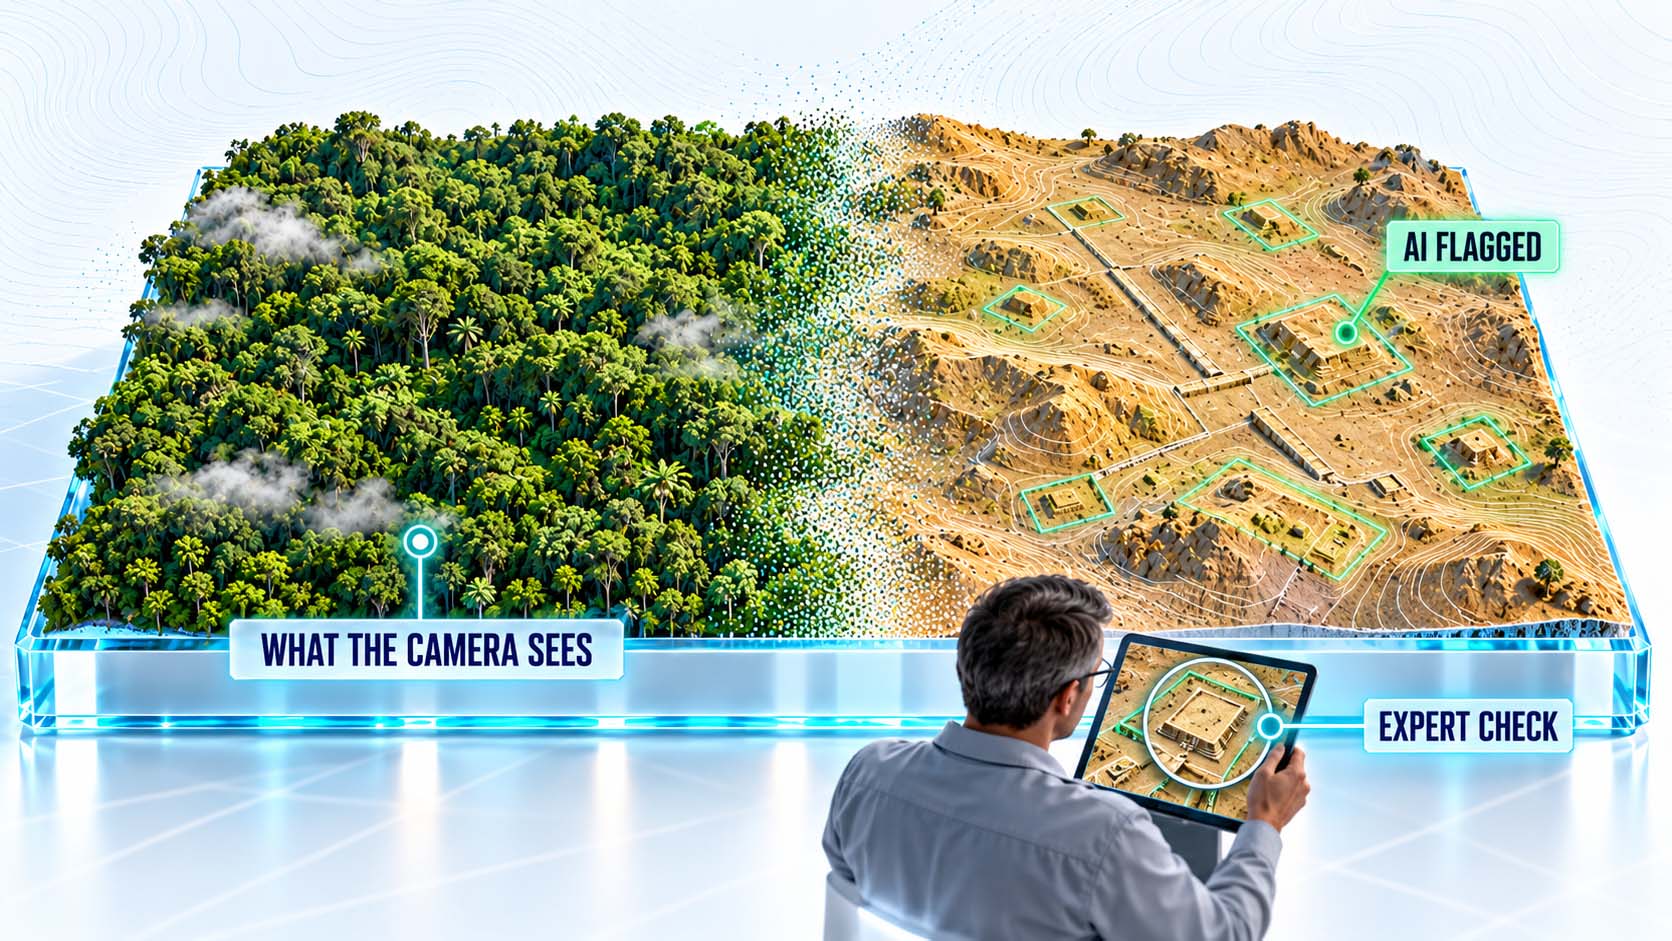
Where the camera sees only forest, the terrain reveals its history.
Infographic: A terrain model without vegetation reveals hidden structures, AI can flag anomalies, and the assessment remains with experts | Graphic: © Ulrich Buckenlei | XR Stager Online Magazine | VISORIC GmbH
For companies, this is far more than a niche archaeological topic. The same principle helps with very practical questions. Before construction work, old ditches, embankments, fill areas or ground monuments can be identified, whose late discovery causes construction delays and costs. Along route corridors, embankment edges, traces of landslides and erosion gullies become visible. On industrial brownfields, landforms provide clues to previous uses. In practice, it pays to build such checks into site assessment early, while the findings can still influence planning decisions.
For all the fascination, one thing holds: an anomaly in the terrain model is an indication, not a finding. Automatic pattern search also produces false positives, and only experts on site can clarify what a structure actually is. The next chapter shows how a measurement becomes a responsible system.
- LiDAR revealed 61,480 Maya structures beneath the rainforest.
- The study was published in 2018 in the journal Science.
- AI can flag conspicuous shapes in terrain models.
- Hidden structures become visible early, before construction.
- An anomaly is an indication, the assessment stays with the expert.
The ability to see through the surface thus turns risks into knowledge while it can still influence decisions.
Accuracy, law and responsibility
A digital twin of the landscape influences decisions with real consequences: investments, permits, construction schedules. Reliability thus becomes a property that must be documented. Every delivery should state which sensor, flight altitude and point density were used for capture, which ground reference points were used and which accuracy was achieved against independent checkpoints.
Manufacturer figures are a guideline, not a result. The three to four centimeters stated by the manufacturer apply under defined conditions.[2] In the field, satellite reception, vegetation density, surface material, weather and processing affect the result. That is why a check against checkpoints that were not included in the calculation is part of every reliable survey. The same applies to Gaussian Splatting models: they look convincing, but their geometric accuracy must be checked separately before measurements are taken on them.
Then there is the legal framework. In the European Union, Implementing Regulation 2019/947 governs the operation of unmanned aircraft in three categories: open, specific and certified. In the open category, rules include a height limit of 120 meters and flight within visual line of sight, while operations beyond that require an operational authorization.[11] Drones with a camera or sensor capable of capturing personal data must be registered, and member states can restrict flights in certain areas for reasons of security, privacy and environmental protection.[11]
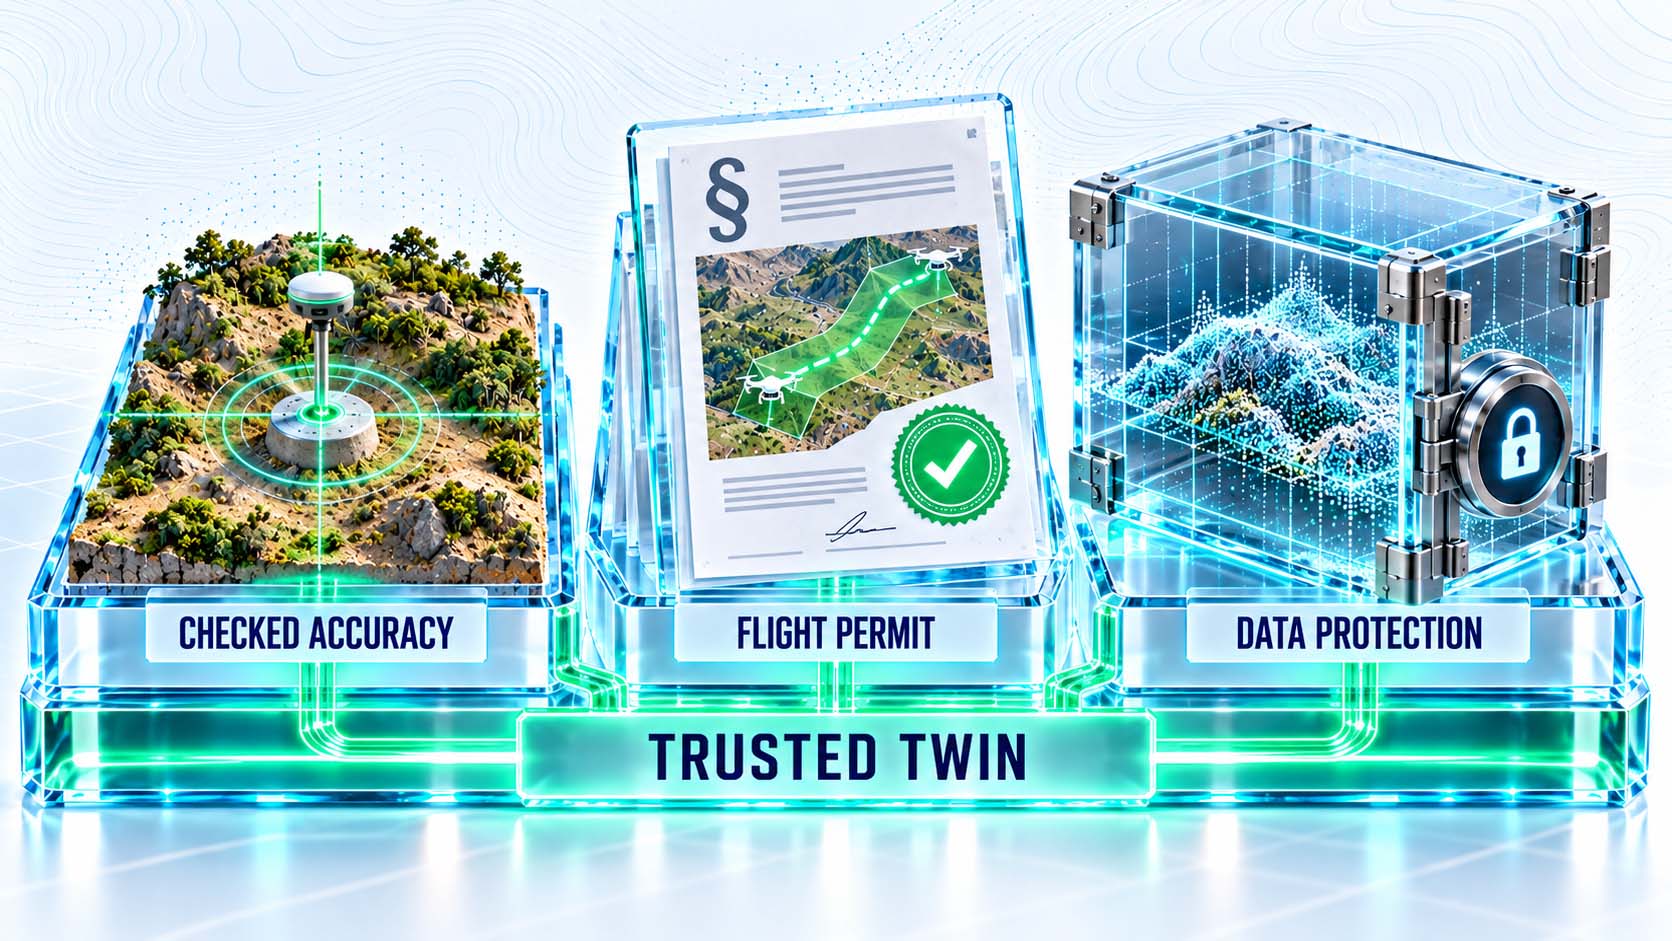
Trust comes from verification, authorization and protection.
Infographic: A reliable digital twin of the landscape combines verified accuracy, legally compliant flight operations and protected data | Graphic: © Ulrich Buckenlei | XR Stager Online Magazine | VISORIC GmbH
| Reference | Point density | Vertical accuracy | Classification |
|---|---|---|---|
| USGS Quality Level QL2 | at least 2 points per m² | 10 cm | Common level for national surveys |
| USGS Quality Level QL1 | at least 8 points per m² | 10 cm | Higher density for detailed analyses |
| USGS Quality Level QL0 | at least 8 points per m² | 5 cm | Highest level of the program |
| Drone LiDAR (manufacturer specification) | Depends on flight altitude and pulse rate | around 3 cm at 120 m flight altitude | Laboratory value, verify in the field against checkpoints |
Overview: Quality levels of the USGS elevation program compared with the manufacturer specification of a current drone LiDAR | Table: © Ulrich Buckenlei | XR Stager Online Magazine | VISORIC GmbH
For companies, responsibility also includes handling the data itself. High-resolution captures show buildings, vehicles, properties and possibly people. Plant sites and critical infrastructure are security-relevant. That is why rules are needed for access, storage, sharing and deletion, especially when external service providers are involved or models are shared via link. Labeling is just as important: a model must make clear what was measured, what was calculated and what was simulated, and which capture date it is based on.
Such rules do not slow things down. They make results comparable, usable and reliable for authorities and investors alike. The drone survey in the video is therefore a strong example when its limits are named honestly. The following chapter shows how the video makes the initial question of this article visible.
- Every delivery documents sensor, flight and reference points.
- Accuracy is checked against independent checkpoints.
- EU Regulation 2019/947 governs drone operations.
- Sensor drones must be registered.
- Access, storage and labeling of the data are regulated.
The next level of maturity therefore comes from traceable quality that can support decisions, far more than from additional points.
The forest without trees in the video
The video shows the evaluation of a real drone survey of terrain in Porto Belo in the Brazilian state of Santa Catarina. It shows the drone’s laser beams above the point cloud, the color aerial image with mountain, town and fields, the classification into vegetation, buildings and ground, the terrain model without forest, the elevation model with simulated runoff lines and the finished map with roads, buildings and property boundaries.[1]
The strongest moment is the transition from the forested mountain to the bare relief. In that instant, something becomes visible that a camera could never show: channels, edges and landforms hidden beneath the Atlantic Forest. Shortly afterwards, blue lines spread across the terrain, showing where water will flow. Within a few seconds, a survey becomes a basis for planning.
The technical context is real and well documented. According to the manufacturer, the sensor used captures up to two million pulses per second and up to 16 returns per pulse, with a system accuracy in the range of a few centimeters.[2] The figure of 1.7 billion measurements comes from the surveying firm’s description and has not been independently verified.
Video: Drone survey with LiDAR, from laser scan through terrain model to map | Visuals by original creators | Analysis, voiceover, editing and video production: © Ulrich Buckenlei | XR Stager Online Magazine | VISORIC GmbH
It is remarkable how naturally the video shows a measurement chain that only a few years ago required survey aircraft and specialized teams. It is a convincing example of how accessible precise terrain capture has become.
Putting it in context also means this: the video shows the results, not the verification behind them. Whether the accuracy was confirmed against checkpoints, how dense the ground points beneath the forest actually are and which assumptions went into the runoff simulation cannot be derived from the clip. Its real question points to the next stage: How does a one-time capture become a digital twin that remains photorealistically understandable, measurably accurate and up to date over time?
- The video shows a real drone survey in Brazil.
- The transition from forest to relief shows the strength of LiDAR.
- The runoff lines turn measurement into a basis for planning.
- The number of measurements comes from the creator’s description.
- The next stage connects measurement, appearance and time.
The video makes visible what the chapters describe: the technology is available, and the value comes from connecting measurement, representation and decision.
You know your site, we make it spatially tangible
A reliable digital twin of a site emerges from two kinds of knowledge. The company knows its areas, buildings, projects and the decisions that should become faster or safer. Implementation requires experience with drone capture, Gaussian Splatting, 3D data and interfaces that experts, management and the public understand without training. This very combination forms the core of VISORIC GmbH’s work.
For more than 15 years, the Munich-based expert team has been developing applications in 3D, AI and XR for companies ranging from mid-sized businesses to DAX corporations. VISORIC plans drone captures for Gaussian Splatting, processes the images into georeferenced, photorealistic 3D models and combines them with existing survey, LiDAR and planning data. VISORIC brings the results together in the XR Stager platform, in the browser, on large displays or in XR. Experience from proof-of-concept projects, for example in the real estate sector, flows directly into capture planning, hardware selection and processing.

Site knowledge and capture expertise together make a reliable pilot.
Image: The company contributes site, project and decision, the expert team contributes drone capture, Gaussian Splatting and spatial processing | © Ulrich Buckenlei | XR Stager Online Magazine | VISORIC GmbH
Getting started does not have to be big. A clearly defined pilot makes sense: one site, one drone capture, one concrete planning or communication question and one responsible role. It is defined in advance which accuracy is needed, which existing data is included, what is measured and what is only visualized, and how the result may be shared. Only once this pilot has proven its value is it worth adding further sites, repeated captures or simulations. This way, the digital twin grows with demonstrable benefit instead of complexity. The standardization of Gaussian Splatting in the glTF format[6] and established classification standards for LiDAR[4] ensure that the results remain exchangeable in the long term.
- Selection of one site and one decision that should improve.
- Drone capture with Gaussian Splatting, combined with LiDAR where needed.
- Spatial processing in the browser, measured against the previous workflow.
Precisely because precise capture is so accessible today, now is a good time to make the first site digitally tangible.
Which site in your company would benefit most from a digital twin?
Talk to the VISORIC expert team in Munich. Together we review your starting point, select a measurable use case and develop a pilot that shows what drone capture and Gaussian Splatting can achieve for your project.
Contact:
Email: info@visoric.com
Phone: +49 89 21552678
Sources and references
- Instagram reel by the account @geoservice_ac, Geo Service, “Do nada ao mapa”, survey of terrain in Porto Belo, Santa Catarina, Brazil, October 2026. Primary source for workflow and equipment used, number of measurements not independently verified. instagram.com/geoservice_ac.
- DJI Enterprise. Zenmuse L3, technical specifications, system accuracy, pulse rates and number of returns. enterprise.dji.com/zenmuse-l3/specs.
- U.S. Geological Survey. Topographic Data Quality Levels (QLs), 3D Elevation Program. usgs.gov/3d-elevation-program/topographic-data-quality-levels-qls.
- American Society for Photogrammetry and Remote Sensing (ASPRS). LAS Specification 1.4, standard class codes for LiDAR points, documented in Esri, Lidar point classification. desktop.arcgis.com.
- Kerbl, B., Kopanas, G., Leimkühler, T., Drettakis, G. 3D Gaussian Splatting for Real-Time Radiance Field Rendering. ACM Transactions on Graphics 42(4), SIGGRAPH 2023. arXiv:2308.04079.
- The Khronos Group. Khronos Announces glTF Gaussian Splatting Extension, press release of February 3, 2026. khronos.org/news/press/gltf-gaussian-splatting-press-release.
- Wenzel, K., Esri. Talk on the georeferenced Gaussian Splatting dataset of the Netherlands, INTERGEO 2026, Munich, own recording and analysis.
- Directive 2007/60/EC of the European Parliament and of the Council on the assessment and management of flood risks. eur-lex.europa.eu.
- Lague, D., Brodu, N., Leroux, J. Accurate 3D comparison of complex topography with terrestrial laser scanner. Application to the Rangitikei canyon (N-Z). ISPRS Journal of Photogrammetry and Remote Sensing 82, 2013, pp. 10 to 26. doi.org/10.1016/j.isprsjprs.2013.04.009.
- Canuto, M. A., Estrada-Belli, F. et al. Ancient lowland Maya complexity as revealed by airborne laser scanning of northern Guatemala. Science 361(6409), eaau0137, 2018. Summary: phys.org/news/2018-09-unprecedented-massive-scale-lowland-maya.html.
- Commission Implementing Regulation (EU) 2019/947 on the rules and procedures for the operation of unmanned aircraft, and German Federal Ministry of Transport, information on drones. eur-lex.europa.eu/eli/reg_impl/2019/947/oj/eng, bmv.de/drohnen.
- VISORIC practical projects in Gaussian Splatting, drone capture, digital twins and spatial computing.
- XR Stager platform for real-time 3D, digital twins and industrial spatial computing applications.
Contact Us:
Email: info@xrstager.com
Phone: +49 89 21552678
Contact Persons:
Ulrich Buckenlei (Creative Director)
Mobil +49 152 53532871
Mail: ulrich.buckenlei@xrstager.com
Nataliya Daniltseva (Projekt Manager)
Mobil + 49 176 72805705
Mail: nataliya.daniltseva@xrstager.com
Address:
VISORIC GmbH
Bayerstraße 13
D-80335 Munich