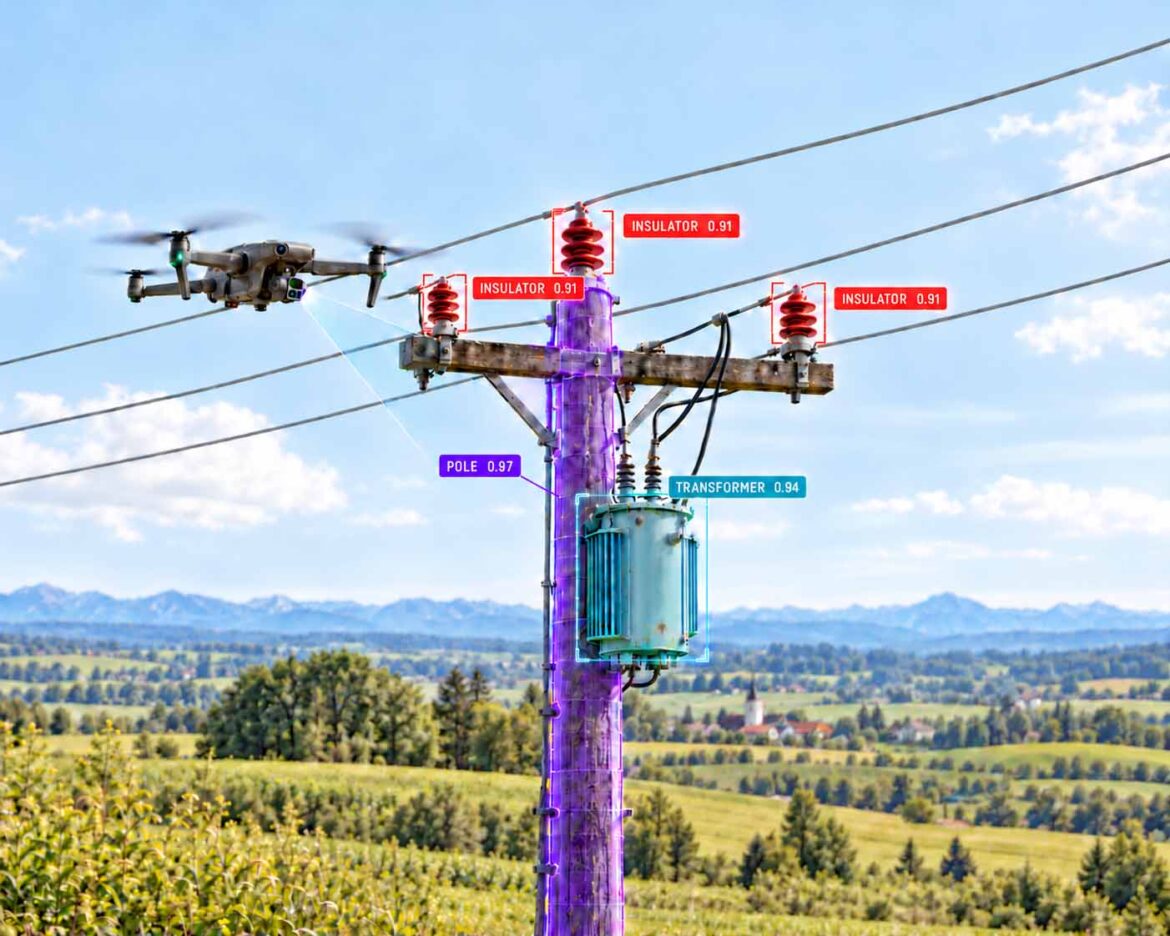
The drone captures the pole, the AI names every component together with a measure of its certainty.
Illustration: AI-assisted depiction of a drone inspection with instance segmentation on a wooden utility pole, masks, component classes and confidence values freely designed, not a product photo | XR Stager Online Magazine | VISORIC GmbH
A storm sweeps across a rural region, and the next morning dozens of power lines are down. Until now, that meant a search. Crews drive the routes, check pole after pole with binoculars and report by phone what they see. Today there is another way. A drone flies along the line of poles, and an AI recognizes in every video frame where a pole is standing, where it has fallen and where a transformer is missing. The finding goes straight, with coordinates, into the system in which repairs are planned.
The challenge is one of scale. According to the U.S. Department of Energy, there are around 180 million utility poles in the United States, about 130 million of them made of wood.[1] In Germany, the transmission grid is around 35,000 kilometers long and almost entirely built as overhead lines, while the distribution grid spans around 1.68 million kilometers.[2] Anyone who wants to inspect these assets regularly quickly runs into the limits of staff and time with conventional visual checks.
A webinar by the U.S. software provider Roboflow from August 2026 shows what the chain from capture to work order looks like technically: drone video, component detection, damage classification and handover to the Salesforce work order system.[3] This article uses that example as its starting point. Above all, it explains what companies can learn from it: which technology is behind it, which figures hold up, where the limits are and why the real value is created in the digital twin.
- Power grids consist of millions of individual assets that have to be inspected regularly.
- Drones capture the images, computer vision detects components and damage in them.
- The benefit only materializes when findings arrive automatically in the work order system.
- When the AI’s assessment is uncertain, the decision stays with a human.
- Every inspection flight generates structured spatial data for a digital twin.
This article explains why power grid inspection is reaching its limits, how a machine recognizes a utility pole, how a video frame becomes a repair order, how an inspection model learns, what the field data really shows, how to handle uncertain AI assessments, how inspection data turns into a digital twin and how companies move from a pilot project to scaled operations.
Why Power Grid Inspection Is Reaching Its Limits
Conventional inspection of a utility pole is manual work. Inspectors drive to every pole, look up from the ground with binoculars or use a bucket truck to reach the pole top. The U.S. utility Salt River Project, SRP for short, from Arizona describes how its inspectors managed an average of 30 to 40 poles per day with binoculars, at most around 50.[4] A service provider from Texas puts the effort for a thorough inspection with a bucket truck in rural areas at 15 to 20 minutes per pole.[5]
This pace determines the inspection cycles. The Chicago grid operator ComEd operates around 1.3 million wooden poles and, according to media reports, inspects them on a ten-year cycle.[6][7] Such a cycle can leave rot at the pole top undetected for years, precisely where hardly anything can be seen from the ground. According to media reports, by early August 2026 ComEd had already recorded the year’s 19th major storm event, the highest number in more than two decades.[7]
After a storm, the problem becomes more acute. Then it is not about routine, but about speed. Which line is interrupted, which pole has fallen, where is a branch lying on the line, and which crew with which equipment has to go where? Every hour spent assessing the situation prolongs the power outage for the affected households and businesses.
Worker safety adds to this. Anyone who wants to see a pole top up close has to climb, set up a bucket truck or use a helicopter. Each of these methods takes time, requires access to the site and carries its own risks. The service provider Firmatek describes the conventional approach as a lineworker in a bucket truck setting up at every single pole, and points out that many utilities therefore do not inspect pole tops regularly at all.[5]
In Germany, a large part of the distribution grid runs underground. However, the remaining overhead lines at medium and low voltage, as well as the almost entirely overhead transmission grid, must be inspected regularly from the air.[2] At the same time, experienced lineworkers are retiring, and grid expansion for the energy transition is increasing the number of assets. More assets and fewer experts: this widening gap is the real driver of automated inspection.
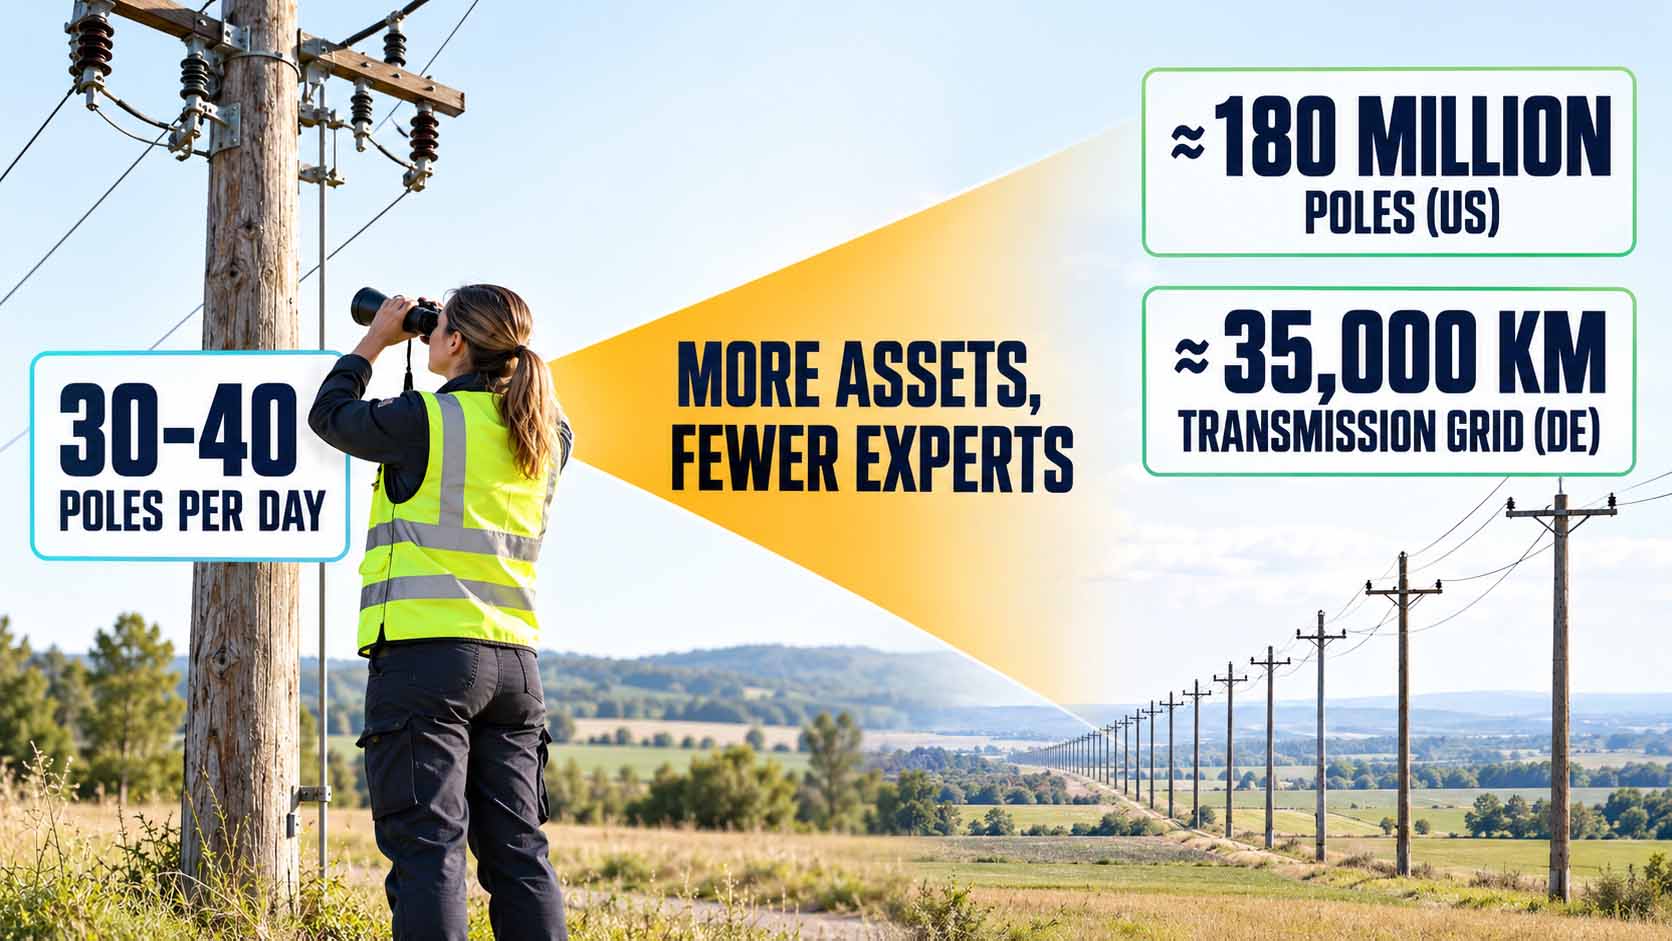
The number of assets is growing faster than the number of people who can inspect them.
Infographic: The gap between asset base and inspection capacity is the real driver of automated inspection[1][2][4] | AI-assisted illustration, not a product photo | XR Stager Online Magazine | VISORIC GmbH
For decision-makers, this leads to a simple guiding question: Which part of their own infrastructure is inspected less often today than would make sense, only because inspection is too costly?
- There are around 180 million utility poles in the US, about 130 million of them made of wood.[1]
- The German transmission grid is around 35,000 kilometers long and almost entirely overhead lines.[2]
- Manual visual inspection covers about 30 to 50 poles per day, depending on the terrain.[4]
- ComEd inspects around 1.3 million wooden poles on a ten-year cycle.[6][7]
- Grid expansion and the skills shortage widen the gap between asset base and inspection capacity.
Closing this gap starts with a simple question: What does an AI actually see when it analyzes the image of a utility pole? The next chapter shows exactly that.
How a Machine Recognizes a Utility Pole
Computer vision is the field of artificial intelligence that analyzes images and videos. Three tasks that build on each other matter for inspection. Classification answers what can be seen in an image, for example a utility pole. Object detection also answers where it can be seen and draws a rectangular frame, a so-called bounding box, around each detected object. Instance segmentation goes further and traces the exact outline of each individual object pixel by pixel. This area is called a mask.
The colored areas in the video accompanying this article are such masks. Each color stands for a component class: pole, transformer, insulators, crossarm. The overlay in the video names the model used, RF-DETR Seg, and describes that boxes and masks are created in a single computational pass. RF-DETR is an open model family for object detection and instance segmentation developed by Roboflow and released under the permissive Apache 2.0 license.[8]
The difference between box and mask matters in practice. A box only says that an insulator is somewhere within this rectangle. A mask shows its actual shape and cleanly separates it from the background and neighboring components. Only then can follow-up questions be asked. Is the insulator complete? Is the pole standing upright? Is a branch lying on the line? Roboflow itself stresses that locating a component is only the first step, and that assessing its condition requires images of sufficient resolution and a model trained specifically for that purpose.[3]
Every detection comes with a confidence value, a number between 0 and 1 that expresses how certain the model is. This value is not proof, but the model’s estimate of itself. It is nevertheless central to operations, because thresholds let a company decide which findings proceed automatically and which are reviewed by an expert. Chapter 6 takes up this point.
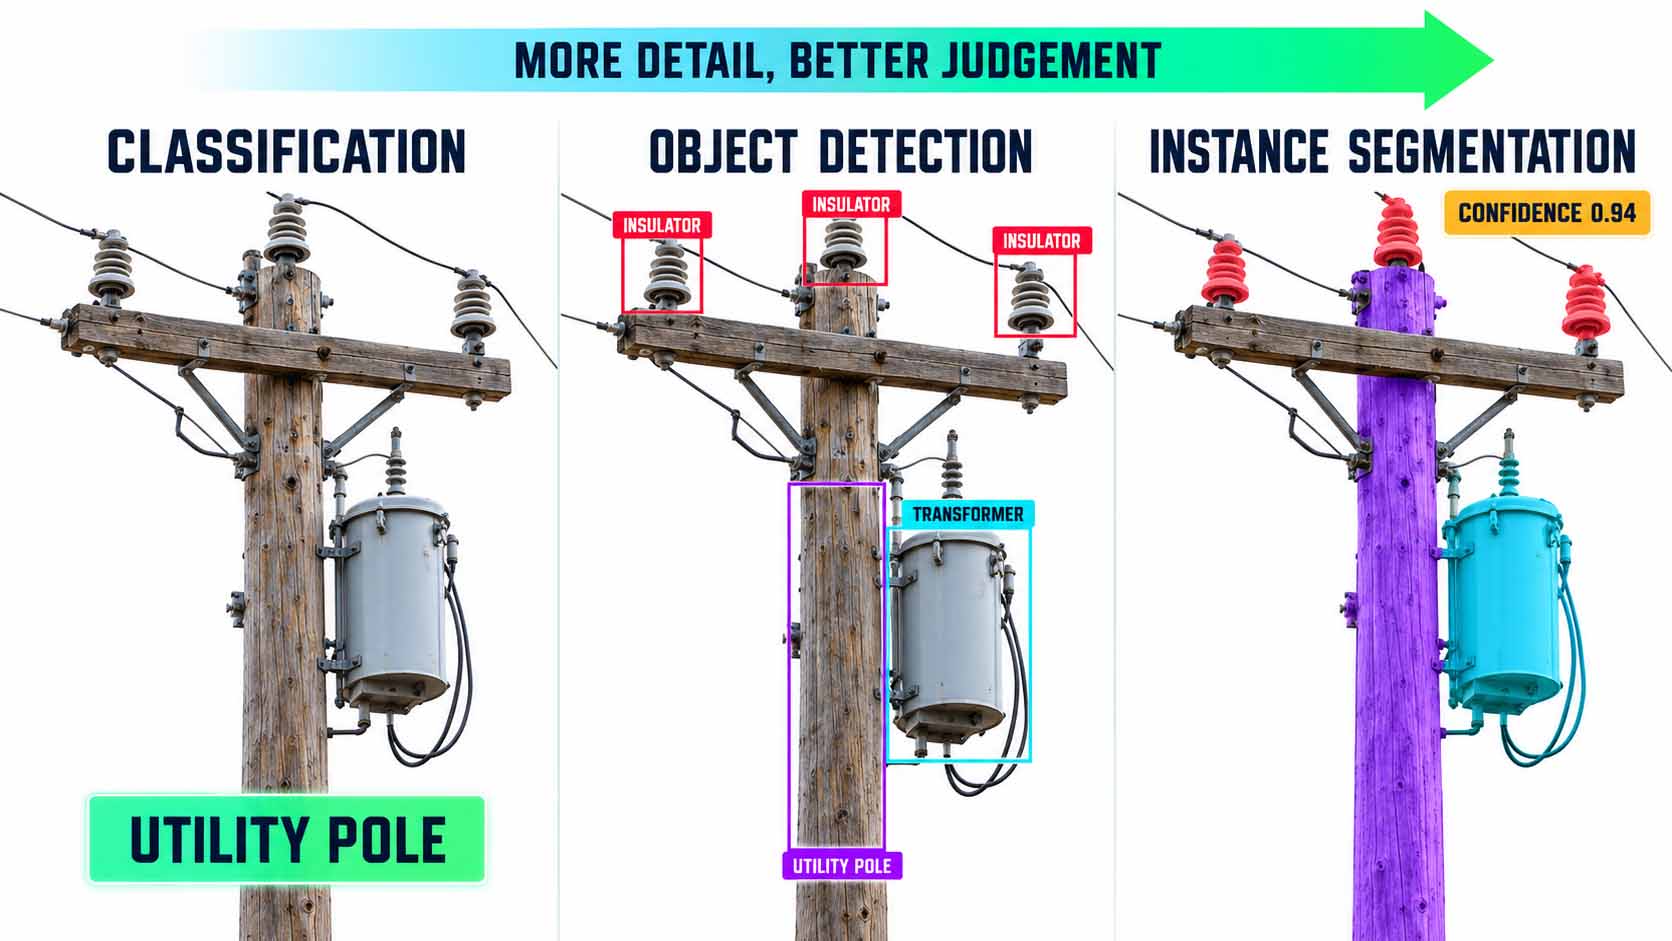
The more closely the machine looks, the more precisely the condition of a component can be assessed.
Infographic: Only the pixel-accurate mask makes condition questions such as completeness and tilt answerable[8] | AI-assisted illustration, values illustrative, not a product photo | XR Stager Online Magazine | VISORIC GmbH
| Method | Question | Result | Use in inspection |
|---|---|---|---|
| Classification | What is in the image? | One label per image | Pre-sorting large image volumes |
| Object detection | What and where? | Box with class and confidence | Counting and locating components |
| Instance segmentation | What exact shape? | Pixel mask per object | Assessing condition, tilt and clearances |
Each stage answers one more question.
Table: Editorial overview of image analysis methods | XR Stager Online Magazine | VISORIC GmbH
Modern models are fast enough for real-time video. For the RF-DETR Seg family, Roboflow states processing times of a few milliseconds per image on an NVIDIA T4 graphics card, depending on model size.[8] Detection can therefore run during the flight or immediately afterwards, instead of days later in an office. For your own planning, it is worth asking: Is it enough to find a component, or does the system have to assess its condition?
- Computer vision analyzes images and videos automatically.
- Object detection draws boxes, instance segmentation draws pixel-accurate masks.
- RF-DETR Seg creates boxes and masks in a single pass and is released under Apache 2.0.[8]
- Every detection carries a confidence value that determines how it is handled next.
- Recognizing a component is only the first step toward assessing its condition.[3]
A detected component does not repair anything yet. How a detection becomes a work order is shown in the next chapter.
From Video Frame to Repair Order
In the Roboflow webinar, two of the company’s implementation engineers present an application for storm damage assessment.[3] The drone video plays on the left, and on the right a map shows the drone’s current GPS position. As the video runs, the application marks observations along the route: a pole that needs to be replaced along with its transformer, a pole that is still standing but no longer carries a transformer, and intact standing poles.
The model does not only detect damage to the line itself. In the example, additional classes for broken branches and street signs were trained.[3] This is not a detail, but the basis for dispatch planning. A branch on the line first requires a vegetation crew before the line crew can even start working. A broken pole requires different equipment than a damaged transformer.
The decisive step is the handover. In the demo, the corresponding work orders appear next to the video in the Salesforce customer and service platform. Roboflow describes how a production solution processes an image, retrieves the detections, annotates the result and passes the information on via a Salesforce block. The transferred data can include the observed damage and the type of crew required.[3]
This creates a continuous chain. The video provides the evidence, the model detects the trained conditions, and the integration carries the information into the repair process. It is important to note what the demo shows and what it does not. It shows a technically continuous path. It does not show how a grid operator deals with false alarms, duplicate reports or contradictory findings in everyday operations. These are exactly the questions that decide success in scaled operations.
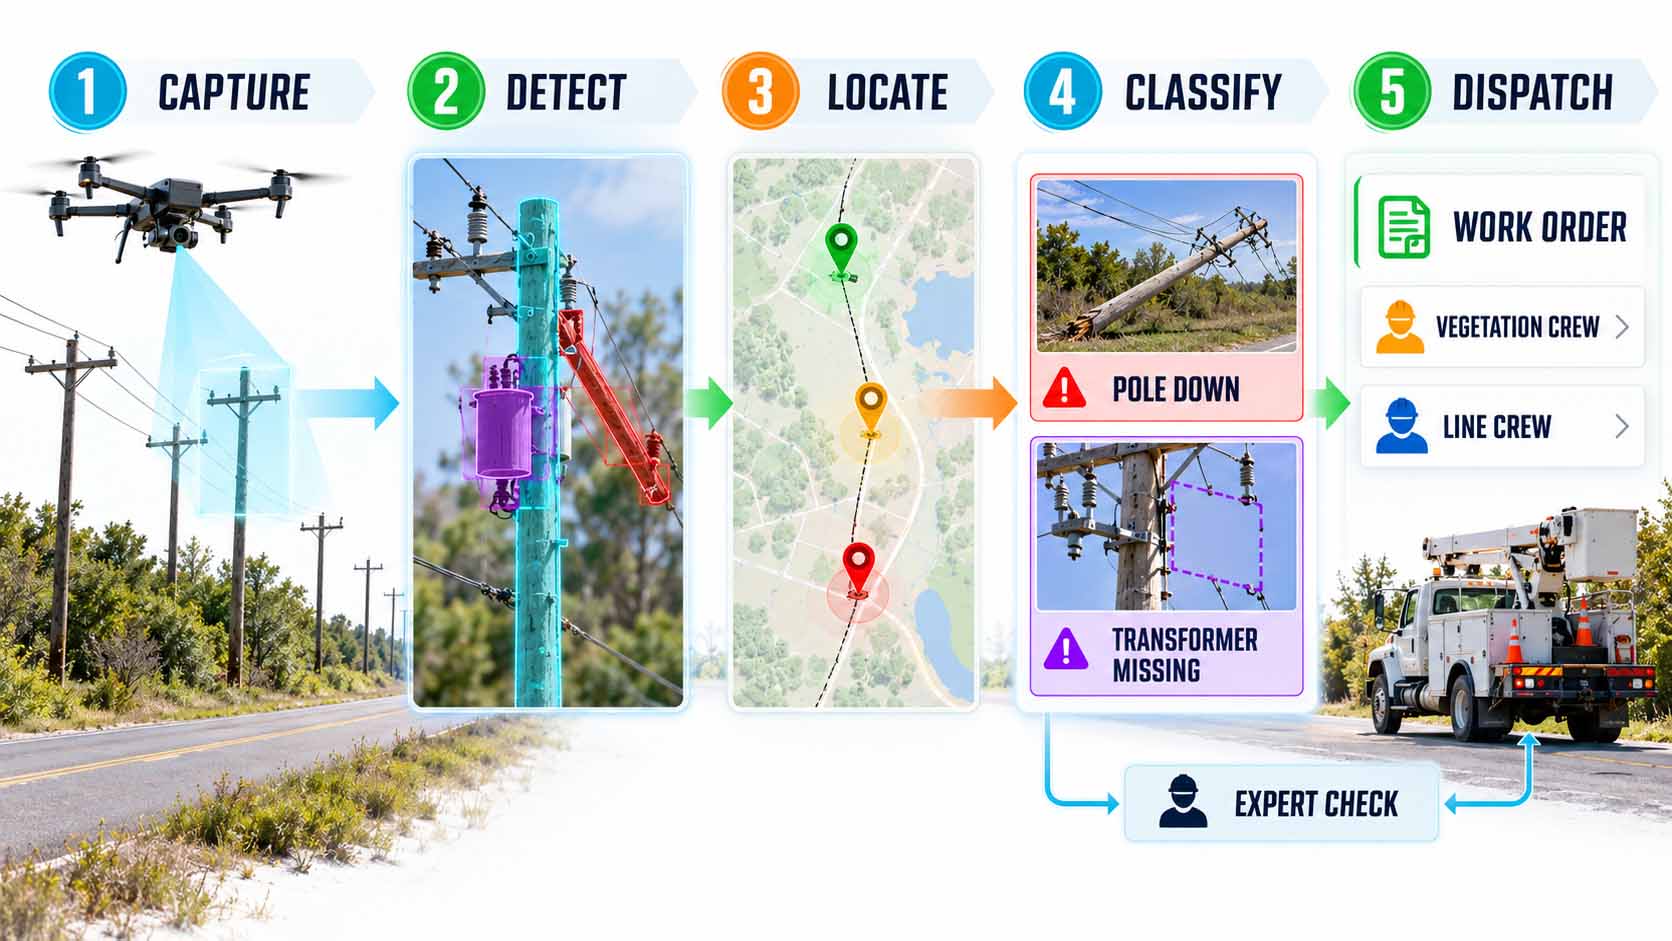
The value is not created in the image, but in the work order that follows from it.
Infographic: Only the link between detection, location, expert review and work order system turns images into a repair process, following the sequence of the Roboflow demo[3] | AI-assisted illustration, work order data freely designed, not a screenshot | XR Stager Online Magazine | VISORIC GmbH
| Finding | Required crew | Typical equipment |
|---|---|---|
| Branch on the line | Vegetation crew, then line crew | Saw, bucket truck |
| Pole down | Line crew with pole setting | Digger derrick or crane truck, replacement pole |
| Transformer missing or damaged | Line crew | Replacement transformer, bucket truck |
| Pole leaning | On-site assessment by an expert | Measurement, bracing if required |
The type of damage determines who goes out.
Table: Editorial example of assigning findings to field crews, based on the Roboflow demo[3], not a specification by a grid operator | XR Stager Online Magazine | VISORIC GmbH
The images do not have to come from drones only. Roboflow also shows a vehicle-mounted camera that flags leaning poles while driving, using footage from trips crews are making anyway.[3] ComEd likewise uses drones, vehicle cameras and mobile devices for its image analytics program.[9] For your own operations, the key question is: In which system is work planned today, and how do findings get there without anyone having to retype them?
- The demo links drone video, GPS position and detection on a map.[3]
- Secondary conditions such as broken branches are detected as well.[3]
- Findings flow into Salesforce as work orders with damage type and crew type.[3]
- In addition to drones, vehicle cameras provide further image sources.[3][9]
- The demo shows the technical path, not how false alarms are handled in everyday operations.
For a model to reliably detect poles, transformers and branches, it first has to learn what they look like. That is the topic of the next chapter.
How an Inspection Model Learns
A model only recognizes what it has learned. For that, it needs training data, meaning images in which people have marked which component can be seen where and what condition it is in. This marking is called annotation or labeling. For masks, it means drawing an exact outline around every component in every image. For poles with several insulators, crossarms and a transformer, this quickly becomes a large share of the overall project effort.
This is where a new division of labor comes in. Large, general-purpose AI models, so-called foundation models, take over the pre-labeling. In the webinar, a Roboflow engineer describes in natural language which components he wants marked. A multimodal language model and Meta’s SAM 3 segmentation model generate the masks from that. For the example shown, the team reports 1,000 segmentation masks in 71 seconds, and explicitly clarifies that these are masks across the entire video footage, not 1,000 inspected poles.[3]
The large models are too slow and too expensive for continuous operation. That is why a smaller, specialized model is trained with the generated labels. In the webinar, an RF-DETR Seg model of size Small is created this way in about seven minutes. The measured processing time via the cloud API is 9.3 milliseconds per image.[3] The principle can be transferred. The large model provides knowledge and speed for labeling, the small model handles the thousandfold repetition in the field.
Pre-labeling does not replace expert review. Roboflow recommends checking the generated annotations and adding examples of different poles, environments and conditions from one’s own service territory.[3] A model that only knows wooden poles in sunshine will fail on concrete poles in fog. The Electric Power Research Institute EPRI, the research institute of the U.S. power industry, collected and classified more than 7,000 images of transmission and distribution assets for this purpose, made them available to more than ten vendors for training and then evaluated the systems on a held-back test dataset.[10]
For companies, this shifts the question. The model itself becomes an interchangeable component that is openly available. The real value lies in one’s own cleanly labeled images of one’s own assets. Those who build this data foundation improve every future model. Those who do not remain dependent on other people’s images.
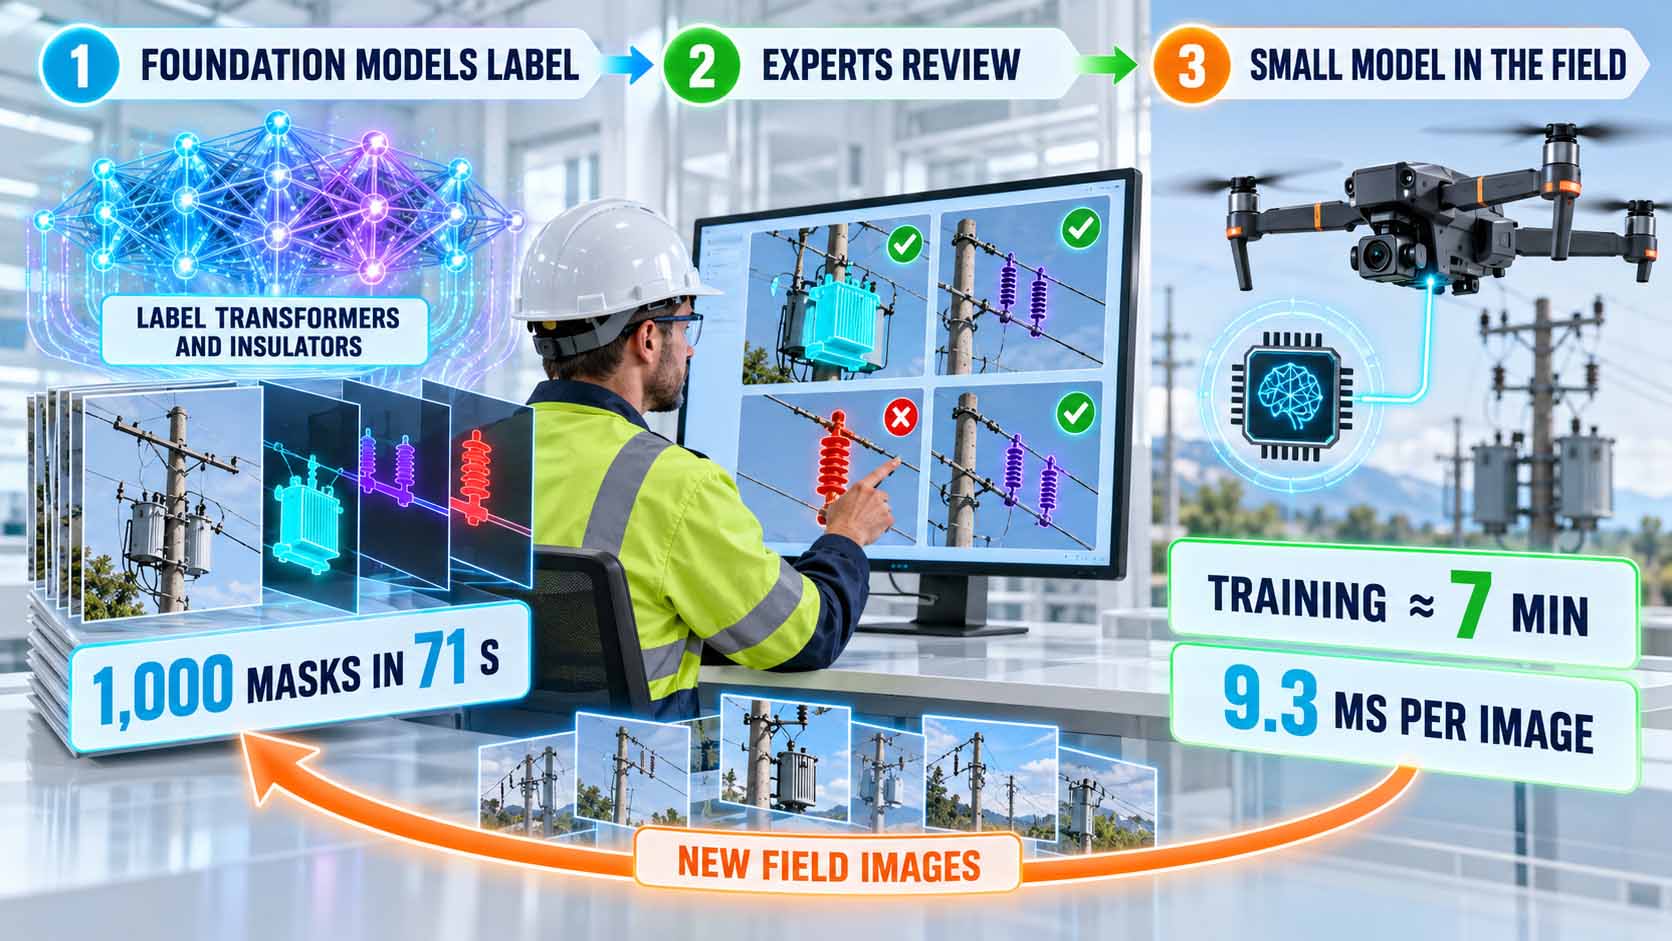
Large models label, experts review, small models work in the field.
Infographic: The lasting value lies in reviewed in-house data, not in any single model, key figures from the Roboflow demo[3] | AI-assisted illustration, not a product photo | XR Stager Online Magazine | VISORIC GmbH
This raises a strategic question for every company: Who owns the images of its own assets, and who maintains them as a training base?
- A model only recognizes what appears in its training data.
- Foundation models such as SAM 3 generate masks from natural language descriptions.[3]
- The demo cites 1,000 masks in 71 seconds, not 1,000 inspected poles.[3]
- A specialized model was trained in about seven minutes and processes an image in 9.3 milliseconds.[3]
- EPRI evaluates inspection AI with more than 7,000 classified images and a held-back test dataset.[10]
How fast and how accurately such systems actually work in practice can only be read from documented deployments. The next chapter shows exactly that.
What the Field Data Really Shows
Impressive figures circulate in posts about AI inspection. For a sound assessment, it pays to separate two things: the speed of data capture by drones and the quality of analysis by AI. The two are often mixed up, but they are based on different sources and measurements.
For capture, the figures are well documented. With drones, SRP increased the number of inspected poles from 30 to 40 to more than 130 to 140 per day and cut the inspection of a 500-pole circuit from two weeks to three to five days.[4] The service provider Firmatek inspected 10,000 poles in one week with drones from the manufacturer Skydio, at 20 to 30 seconds per pole; according to the manufacturer, the project would otherwise have taken three months.[5] For the Australian grid operators Citipower and Powercor, a pilot network captured more than 11,000 poles at around 80 poles per day and reported four times faster inspection and 15 percent more detected defects.[11]
For analysis, the figures need to be read more carefully. ComEd reports an accuracy of 86 percent for its AI program for assessing pole tops compared to the judgment of human experts, and states that the program has prevented almost 3,000 customer interruptions.[6][12] For an earlier image analytics program of the same operator, detection accuracy ranged between 58 and 90 percent depending on the defect type, with a target of 85 percent.[9] EPRI reports that AI found up to 90 percent of certain conditions in individual cases, but still sees room for improvement.[10]
Two caveats apply to each of these figures. First, they mostly come from vendors, service providers or operators themselves and are not independent studies. Second, a single percentage rarely tells the whole story. What matters is how many real defects are missed and how many false alarms experts have to review. An accuracy of 86 percent can be very good or insufficient in everyday use, depending on which error occurs more often and what it costs.
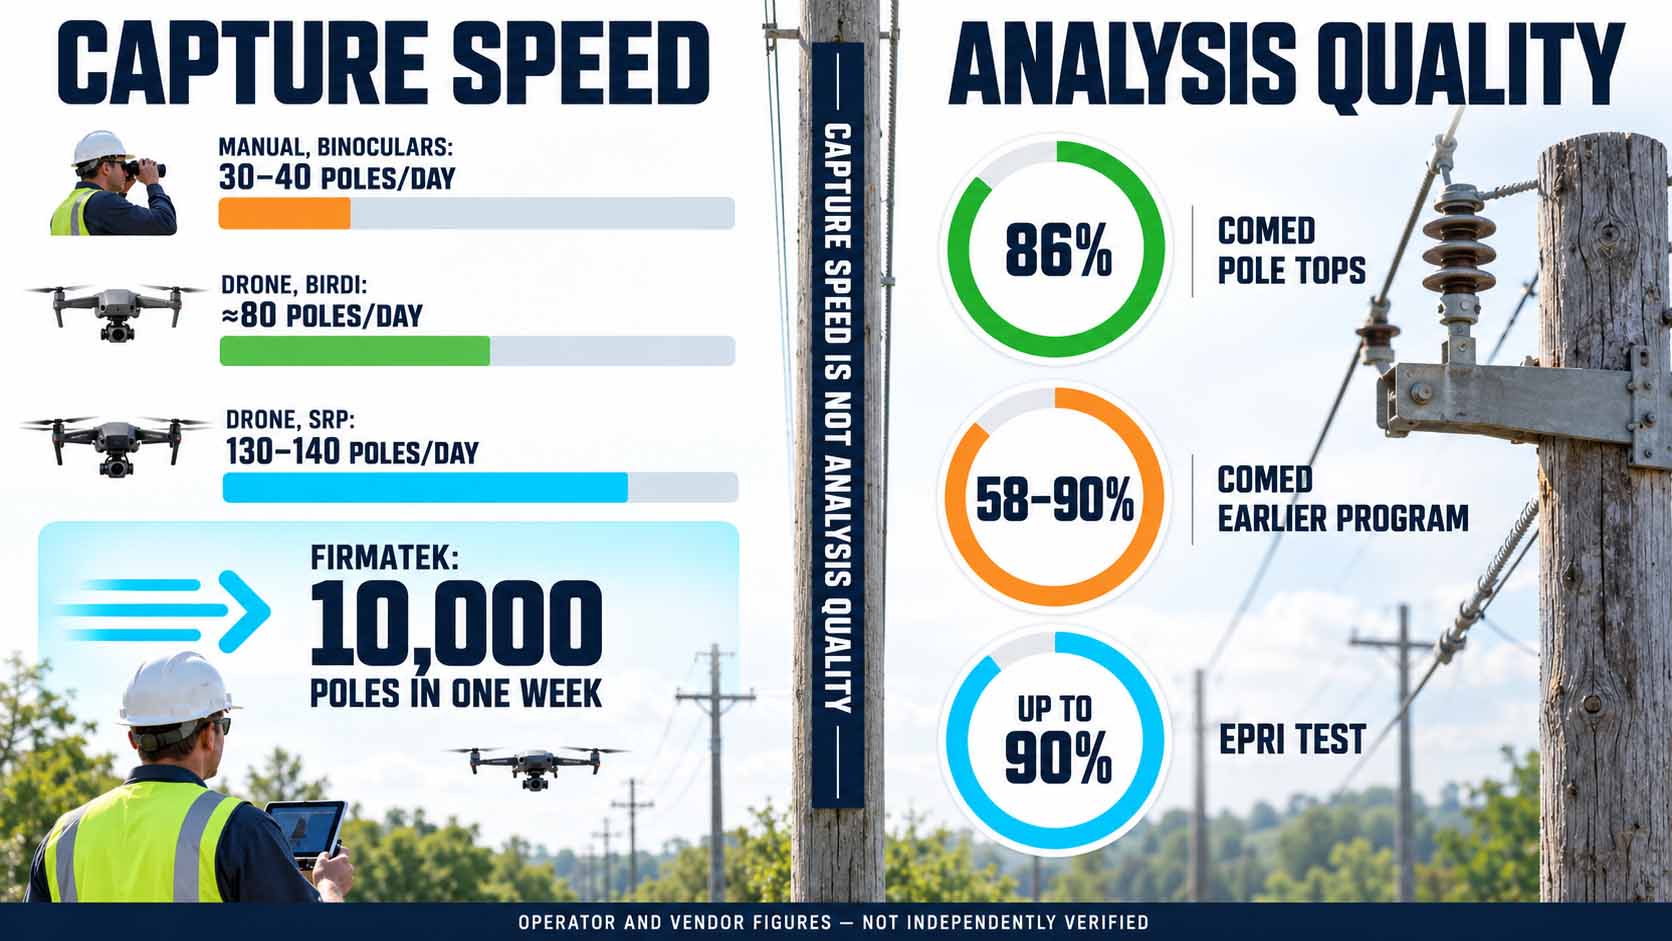
Drones accelerate capture, while every model still has to prove the quality of its analysis.
Infographic: Capture speed and analysis quality are separate metrics and must be assessed separately[4][5][9][10][11][12] | Values based on operator and vendor information, not independently verified | XR Stager Online Magazine | VISORIC GmbH
| Deployment | Metric | Type of source |
|---|---|---|
| SRP, Arizona | 30 to 40 poles per day manually, 130 to 140 with drones | Trade media, operator information |
| Firmatek with Skydio | 10,000 poles in one week, 20 to 30 s per pole | Manufacturer case study |
| Citipower and Powercor with Birdi | More than 11,000 poles, around 80 per day, 15 % more defects | Vendor case study |
| ComEd, AI for pole tops | 86 % accuracy compared to experts | Operator information |
| ComEd, earlier image program | 58 to 90 % depending on defect type | Vendor case study |
| EPRI, comparison test | Up to 90 % for certain conditions | Research institute |
Capture and analysis are two different metrics.
Table: Documented metrics for drone and AI inspection, as stated by the respective sources, not independently verified[4][5][6][9][10][11][12] | XR Stager Online Magazine | VISORIC GmbH
The figures circulating around the video shown here also need to be put into context. The figure of 10,000 poles in one week comes from the Firmatek project and describes image capture, not AI analysis.[5] A frequently cited performance of up to 400 poles per day could not be confirmed in the primary sources reviewed. The robust statement is therefore: drones multiply capture, and AI can significantly accelerate analysis if it is trained with good data and checked by experts. Anyone evaluating a solution should therefore ask: Which error is more expensive for us, the missed defect or the false alarm?
- At SRP, drones increased inspection output from 30 to 40 to more than 130 poles per day.[4]
- Firmatek captured 10,000 poles in one week, which is a capture metric, not an AI metric.[5]
- ComEd cites 86 percent accuracy compared to human experts.[6][12]
- Most figures come from vendors, service providers or operators.
- What matters are missed defects and false alarms, not a single percentage.
Precisely because no AI works without errors, the question arises who decides when the model is uncertain. That is the topic of the next chapter.
When the AI Is Uncertain. Human Oversight in Critical Infrastructure
A comment under the LinkedIn post on this topic gets to the heart of the matter: How does a grid operator handle cases in which the AI’s assessment is uncertain, especially when the decision affects safety and service reliability? The question goes to the core of every automated inspection. A missed defect can lead to a power outage or a danger to people. A false alarm sends a crew out for nothing and costs time that is missing elsewhere after a storm.
A practical answer is to grade findings by confidence and impact. Detections with a high confidence value and low impact, such as an intact standing pole, can be logged automatically. Detections with high impact, such as a damaged transformer, go as a proposal to an expert who confirms or rejects it with a glance at the image. Detections with a low confidence value go into a separate review queue. This directs human attention to where it makes the biggest difference. This grading is an editorial design recommendation, not a requirement of any particular vendor.
In practice, this workflow is already widespread. According to industry analyses, experienced grid experts at German grid operators review the spots marked by the AI, discard false hits and rank real defects by urgency before a work order is created.[2] Roboflow, too, describes detection as a focused starting point for the people doing the review.[3] Every confirmed or rejected detection becomes new training material that improves the model in the next round.
In Europe, a legal dimension is added. The EU Artificial Intelligence Act classifies AI systems as high-risk in Annex III, point 2, when they are used as safety components in the management and operation of the supply of electricity, gas, heating and water. For such systems, Article 14 requires effective human oversight.[13] The obligations for stand-alone high-risk systems under Annex III were postponed by the so-called Digital Omnibus from August 2, 2026 to December 2, 2027.[14] Whether a specific inspection system falls under this depends on whether it makes safety-relevant decisions itself or only prepares proposals for experts; Article 6(3) provides for exceptions.[13][14] This classification has to be clarified legally on a case-by-case basis.
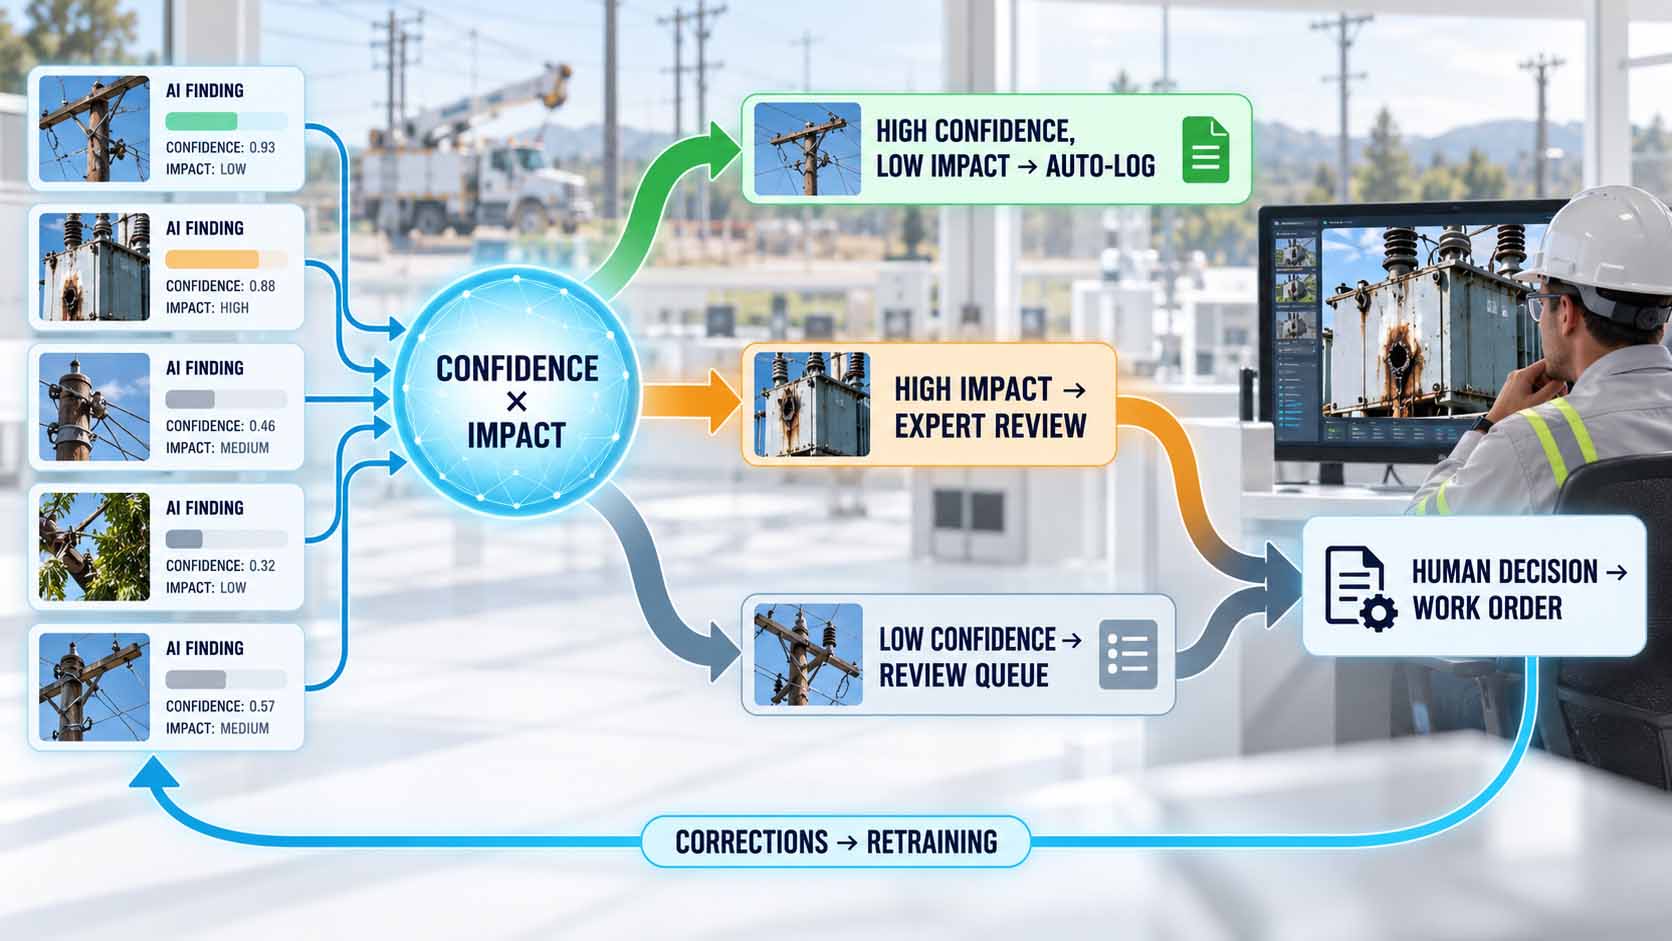
The AI pre-sorts, the expert decides, and every correction improves the model.
Infographic: Human attention is deployed where uncertainty and impact are greatest, editorially developed model | AI-assisted illustration, not a product photo | XR Stager Online Magazine | VISORIC GmbH
| Finding | Confidence | Impact | Handling |
|---|---|---|---|
| Intact, standing pole | High | Low | Automatic logging |
| Damaged transformer | High | High | Confirmation by an expert |
| Unclear discoloration on insulator | Low | Unclear | Review queue |
| Pole down | Any | Very high | Immediate report and review |
Confidence and impact together determine the path of a finding.
Table: Editorial example of a grading rule, not a specification by a grid operator or vendor | XR Stager Online Magazine | VISORIC GmbH
This leads to a clear rule for designing such systems: The user interface must make uncertainty visible. An expert needs the original image, the marked spot, the confidence value, earlier images of the same pole and a simple way to confirm or correct. Those who design this interface well turn review into a fast and traceable work step rather than a bottleneck. For every project, it is worth asking: Which findings may the system log on its own, and which always need a human?
- Missed defects and false alarms cause different costs.
- Confidence and impact together determine whether a human reviews a finding.
- Experts confirm or reject AI findings before a work order is created.[2]
- AI used as a safety component in electricity supply is high-risk under Annex III, point 2, with a deadline of December 2, 2027.[13][14]
- Every correction becomes training material for the next model version.
Once findings are reviewed, located and stored, something more than a list of repairs emerges over time. What it can become is shown in the next chapter.
From Inspection Flight to Digital Twin of the Grid
Every inspection flight generates structured spatial data. Each detection comes with a position, a component class and a condition. On its own, that is a finding. Across many flights and many years, it becomes a model of the entire grid in which every pole is stored with its history. This model is called a digital twin: a digital representation of a real system that is continuously updated with data from operations.
The value lies in repetition. Anyone who photographs the same pole from the same angle year after year detects gradual changes such as increasing tilt, growing vegetation or progressing corrosion. This becomes predictive maintenance: a pole is replaced before it fails. ComEd assigns each inspected pole a health score that helps decide which poles should be replaced or reinforced first.[12]
German grid operators are already taking this path. With its NETZinspect program, Netze BW inspects its 110 kV lines by drone, uses LiDAR, meaning laser-based distance measurement, for centimeter-accurate 3D scans of the corridors and applies AI for damage detection.[2][15] SH Netz has had a digital twin of its approximately 3,000-kilometer high-voltage grid created from aerial imagery, which is used for grid simulations.[16] During the reconductoring of the 380 kV Landesbergen-Borken line with 140 towers over around 60 kilometers, the service provider Omexom uses a digital twin to program the drones’ flight routes before takeoff.[17]
This closes a loop. The digital twin plans the flight, and the flight updates the digital twin. The AI detects changes, the experts assess them, and the result flows into maintenance as a work order and back into the grid model as a data point. A series of individual inspections becomes a living model of the infrastructure.
Such a twin places demands on data management. Thousands of images per flight have to be stored, versioned and assigned to the right pole. In the program ComEd built with a platform provider, the software automatically assigns new images to the right asset based on GPS position and camera direction.[9] Georeferenced aerial images over private property also raise data protection questions under the GDPR, which have to be clarified before scaled operations.[2]
For the people working with this model, presentation is decisive. A digital twin with millions of data points only helps if planners, dispatchers and lineworkers understand it. Spatial visualizations in 3D, in the browser or with mixed reality glasses make visible where damage accumulates, which corridors are particularly affected and what a pole looks like before a crew sets off. Not every 3D model is a complete digital twin. What matters is the link between geometry and current operational data.
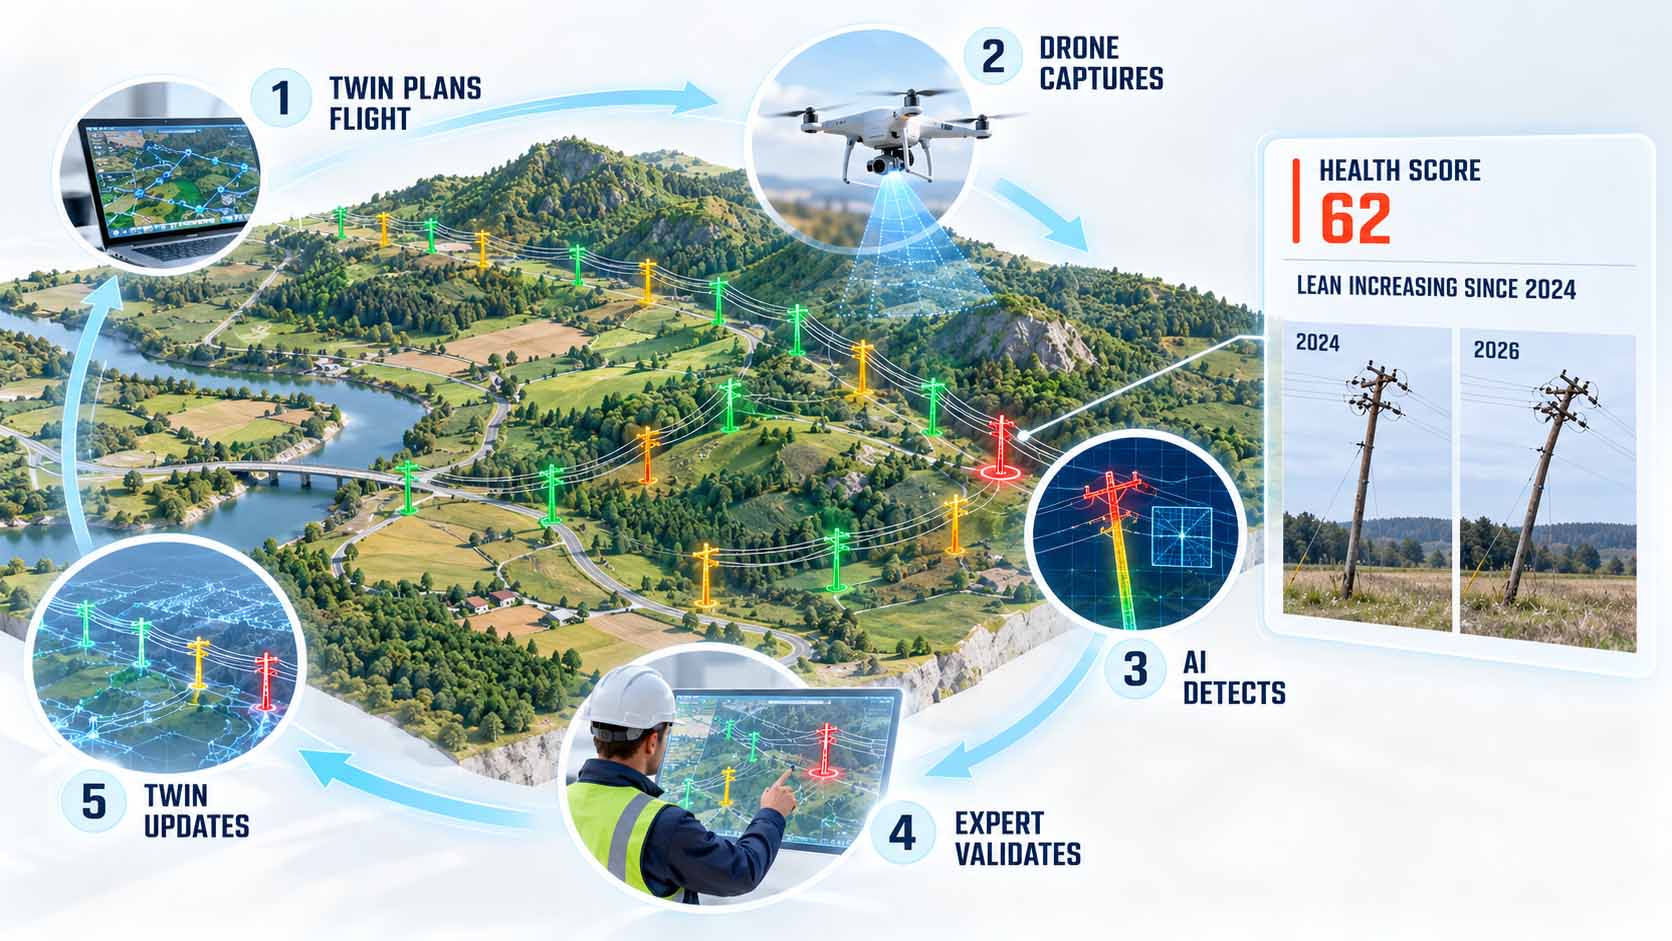
Individual inspections add up to a model of the grid that becomes more accurate with every flight.
Infographic: The digital twin plans the inspection and is updated by it, grid and condition data illustrative[12][15][17] | AI-assisted illustration, not a product photo | XR Stager Online Magazine | VISORIC GmbH
For operators of large asset bases, the question is: Where are the inspection images stored today, and can they be assigned to a location and a component?
- Every detection provides position, component class and condition.
- Repeated images make gradual changes visible.
- ComEd prioritizes replacement and reinforcement using an AI health score.[12]
- Netze BW, SH Netz and Omexom combine drones, LiDAR and digital twins.[15][16][17]
- Only understandable 3D visualizations make the twin usable for teams.
How companies move from a first trial to permanent operations is shown in the final chapter.
From Pilot Project to Scaled Operations
The technology is available; the real hurdles lie in approvals, data and processes. In Germany, drone flights beyond the pilot’s line of sight, known as Beyond Visual Line of Sight or BVLOS, fall into the so-called Specific Category of EU drone regulation 2019/947 and require an operating authorization from the German Federal Aviation Office (Luftfahrt-Bundesamt).[18] Since January 1, 2026, new applications must be submitted using the SORA 2.5 risk assessment method, and according to industry sources processing takes around two to four months.[2] That it can be done was shown by ED Netze as early as 2021 with the service provider FlyNex: around 25 kilometers of overhead line with about 100 poles were flown beyond visual line of sight in three hours.[19]
In the US, the industry is waiting for the FAA’s new Part 108 rule, which is intended to turn BVLOS flights from the exception into the standard. The final text has been under final review at the White House since July 10, 2026, and waivers remain necessary until publication.[20] European operators are governed by their own EU framework. However, developments in the US show how strongly regulation determines the pace of scaling.
A sensible start follows four steps. First, choose a clearly defined task, such as the visual inspection of a line section or post-storm damage assessment in a test area, initially within visual line of sight. Second, define the findings the model should detect, and collect and label your own images for them. Third, define the interface to the existing work order or asset management system so that findings arrive where planning takes place today. Fourth, define KPIs in advance: inspection time per asset, share of confirmed findings, missed defects in spot checks and time to work order.
Economic viability can also be assessed soundly without inventing figures. On the cost side are drones, trained pilots, the approval process, image labeling, integration into existing systems and ongoing operations. On the benefit side are faster damage assessment after storms, fewer bucket truck or helicopter deployments and earlier detection of gradual damage. International experience cites savings of around 50 to 75 percent compared to helicopter inspection.[2] These values come from other markets and cannot be transferred one to one. The calculation only becomes robust with the KPIs from your own pilot.
The pattern is not limited to utility poles. The camera is interchangeable, the principle stays the same: capture an image, detect the component, assess its condition, locate the finding, trigger the work order, update the model. It fits railway lines, pipelines, bridges, wind turbines, industrial roofs or production lines, wherever many similar assets have to be inspected regularly and inspection data is still kept separately from operations today.
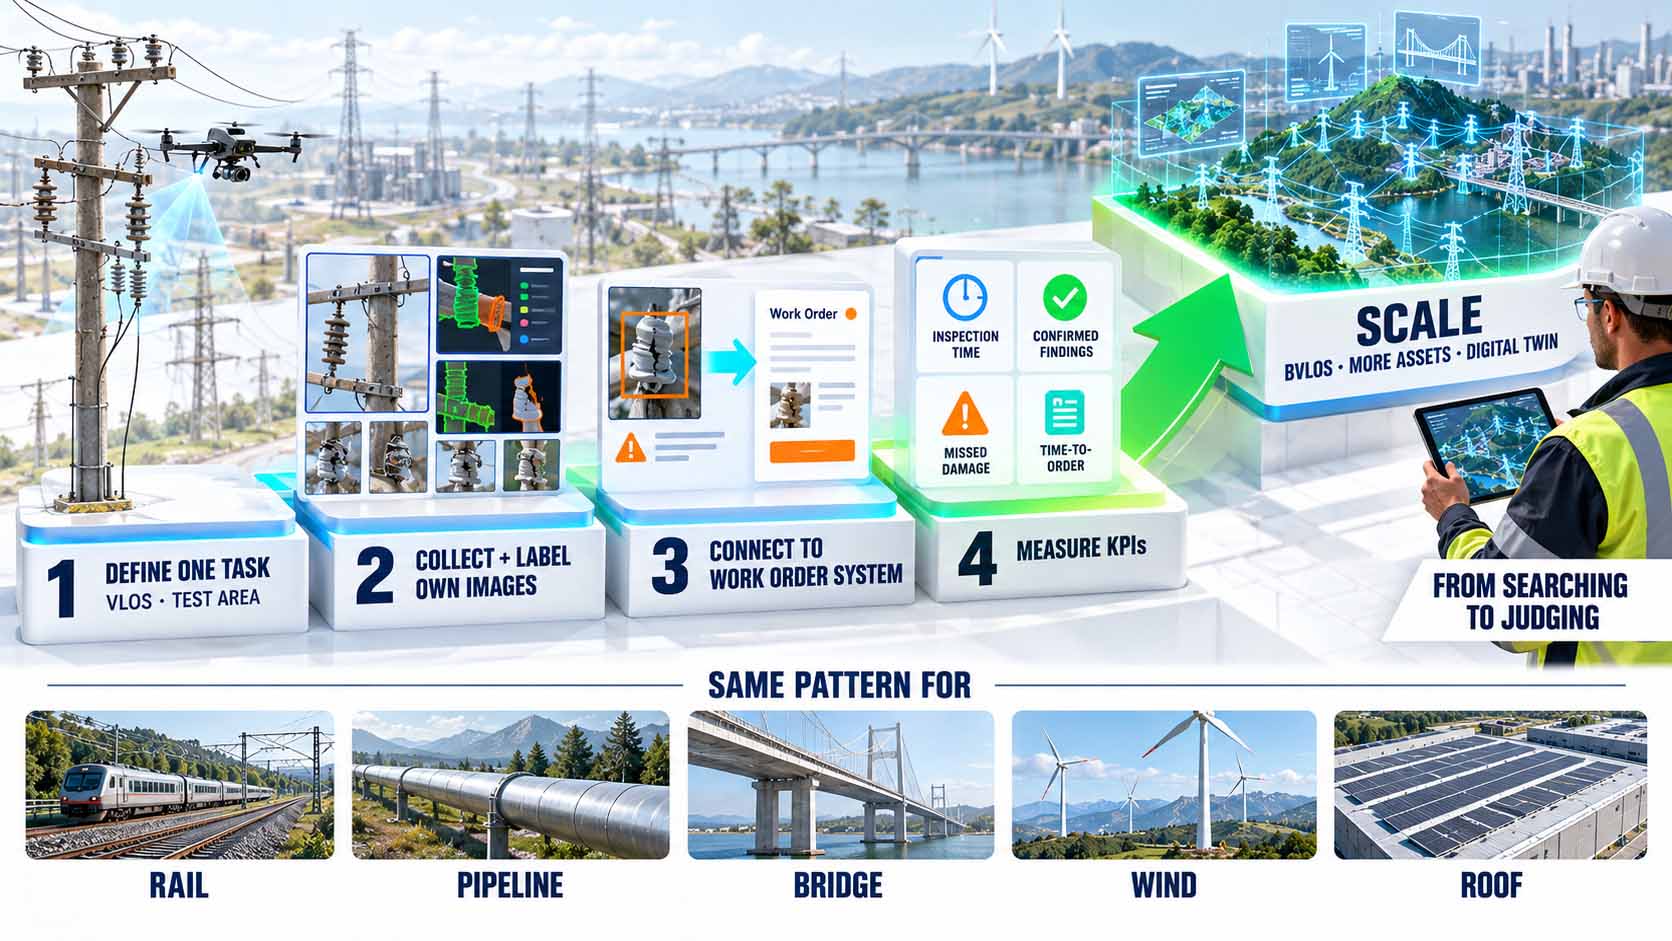
A clearly defined pilot with measurable KPIs is the fastest route to scaled operations.
Infographic: Scaling starts with a small, measurable task and a clear approval path, editorially developed step plan[2][18] | AI-assisted illustration, not a product photo | XR Stager Online Magazine | VISORIC GmbH
| KPI | What it shows |
|---|---|
| Inspection time per asset | Speed of capture |
| Share of confirmed AI findings | Precision in everyday use |
| Missed defects in spot checks | Reliability of the system |
| Time from flight to work order | Impact on the overall process |
Four KPIs show whether a pilot holds up.
Table: Editorially developed KPIs for evaluating an inspection pilot | XR Stager Online Magazine | VISORIC GmbH
That leaves the role of people. Inspectors do not become redundant; their work shifts from the pole to the screen and from searching to judging. This requires new skills: assessing AI findings, recognizing uncertainty, reading digital twins. These skills can be trained in a targeted way, ideally in learning environments that spatially recreate real assets and real findings. Those who plan technology, data and qualification together turn a pilot project into permanent operations. In the end, every company faces the same question: Which asset would be small enough for a safe first trial and important enough for the result to count?
- In Germany, BVLOS flights require an authorization from the Federal Aviation Office in the Specific Category.[18]
- SORA 2.5 has applied since January 1, 2026, and processing takes around two to four months.[2]
- The US Part 108 rule has been under final review at the White House since July 2026.[20]
- A pilot needs a clearly defined task, own data, an interface and KPIs.
- The pattern can be transferred to rail, pipelines, bridges and industrial facilities.
In the end, the drone is just the camera. The value is created in the chain behind it: in clean data, traceable decisions and a digital model that becomes more accurate with every flight. What this chain looks like in motion is shown in the following video.
AI Inspection in Motion
The previous chapters explained how an AI recognizes utility poles, how this turns into work orders and where the limits are. What this looks like in concrete terms can be observed most directly in video.
The video shows a drone flight around a wooden pole with a transformer in open countryside. Colored masks are overlaid on the individual components in real time, and an overlay names the model RF-DETR Seg and the component classes of a utility pole. The footage comes from Roboflow, which presented the application in a webinar in August 2026.[3] When watching, three things are worth noting: how stable the masks remain throughout the movement, how clearly the components are separated from one another and where an expert would still take a closer look. No performance values can be derived from the video alone; the technical information comes from Roboflow’s documentation. Roboflow also points out that part of the webinar material, a video on vegetation before a storm, was artificially generated.[3]
Video: AI inspection of a utility pole with instance segmentation by the RF-DETR Seg model | Visuals by original creators @roboflow | Analysis: Ulrich Buckenlei | XR Stager Online Magazine | VISORIC GmbH
The colored areas look impressive. That is an editorial observation, not proof of quality. What matters is what lies behind the visualization: a trained model, reviewed data and a process that turns a detection into a reliable decision.
- The video shows instance segmentation on a utility pole during a drone flight.
- Footage and application come from Roboflow.[3]
- Performance values come from the documentation, not from the video.
- According to Roboflow, part of the webinar material was artificially generated.[3]
- The question remains: How does a detection become a reliable decision?
This example illustrates why the path from an impressive video to reliable operations takes more than a good model.
From Inspection Image to Digital Twin
A drone makes damage visible, and an AI pre-sorts it. For this to become permanent operations, two further building blocks are needed: a digital twin that makes the findings spatially understandable, and people who can make confident decisions within it.
The expert team of VISORIC GmbH from Munich combines more than 15 years of experience in 3D, AI and XR with hands-on experience in spatial computing, real-time 3D and digital twins. VISORIC develops digital twins, drone-based 3D capture and Gaussian Splatting as well as XR training with which companies make inspection data understandable and prepare their teams to work with AI findings, from the first concept idea to the deployable application.[21][22]

15 years of experience in 3D, AI and XR: the VISORIC expert team from Munich.
Image: © Ulrich Buckenlei | XR Stager Online Magazine | VISORIC GmbH
A well-designed pilot project, a single asset type, a clearly defined area and an understandable 3D visualization of the findings can often be implemented much faster and more cost-effectively than many companies expect.
- Advice on selecting a clearly defined pilot use case for inspection and condition assessment.
- Development of digital twins and 3D visualizations for inspection and operational data.
- XR training in which teams practice working with AI findings safely.
That is exactly the starting point for a conversation: not the big, company-wide vision, but a clearly defined first step that can be implemented quickly.
Which of your assets is inspected less often today than would make sense, and what would change if every finding automatically arrived in the right system?
Talk to the VISORIC expert team from Munich about digital twins, 3D visualization and XR training. Together, we will turn your task into a precise, traceable next step.
Contact:
Email: info@visoric.com
Phone: +49 89 21552678
Sources and References
- U.S. Department of Energy. Resilience Investment Guide, Utility Pole Maintenance and Upgrades. energy.gov, September 2024.
- innobu. KI-gestützte Drohneninspektion von Stromnetzen, BVLOS und automatische Bilderkennung, industry analysis referencing Clean Energy Wire, LBA, Netze BW and TenneT. innobu.com, June 19, 2026.
- Roboflow (Erik Kokalj). Automate Utility Pole Inspection with Roboflow, blog post and webinar with Jennifer Kuchta and Alexei Alexandrovich. roboflow.com, August 14, 2026.
- T&D World. Arizona’s SRP Solves Variety of Tasks with In-House Drone Pilots, trade media. tdworld.com.
- Skydio. Firmatek meets the challenge of inspecting 10,000 poles in one week, manufacturer case study. skydio.com.
- ComEd via Business Wire. ComEd Recognized for Advanced Technology and Customer Programs By National Organizations, press release. businesswire.com, October 16, 2025.
- Hoodline citing CBS News Chicago. ComEd Sends Drones and AI to Hunt Down Rotting Poles Before They Snap, secondary source. hoodline.com, August 25, 2026.
- Roboflow. RF-DETR, repository and documentation for object detection and instance segmentation, Apache 2.0 license, and blog SOTA Instance Segmentation with RF-DETR, October 2, 2025. github.com.
- Optelos. Automating Grid Analytics Through Drone Inspection and Computer Vision AI, vendor case study on ComEd. optelos.com.
- EPRI via T&D World. Can AI Be the Next-Generation T&D Inspection Technology?, research report. tdworld.com.
- Birdi. How Citipower and Powercor inspected their power pole assets 4 X faster with Birdi, vendor case study. birdi.io.
- ComEd. Drone Imagery and AI Technology Speed Up Process for Maintaining Utility Poles, operator article. poweringlives.comed.com, April 7, 2026.
- European Union. Regulation (EU) 2024/1689 laying down harmonised rules on artificial intelligence, in particular Article 6, Article 14 and Annex III, point 2. eur-lex.europa.eu, 2024.
- innobu. EU AI Act, Hochrisiko-KI in der Energie-Infrastruktur, Digital Omnibus and deadline of December 2, 2027. innobu.com, 2026.
- Netze BW. NETZinspect, drones, LiDAR and AI in line inspection, and presentation by J. Scholz, Stuttgart High Voltage Symposium, June 2024. netze-bw.de.
- ZfK. SH Netz: Digitaler Zwilling für umfangreiche Netzsimulationen. zfk.de.
- VDI Fachmedien, ingenieur.de. Die frühe Drohne fängt das Bild, article by Omexom Deutschland. ingenieur.de, November 17, 2025.
- Luftfahrt-Bundesamt (German Federal Aviation Office). Operating authorization for unmanned aircraft in the specific category under Regulation (EU) 2019/947. lba.de.
- FlyNex. FlyNex und ED Netze inspizieren Stromnetz mit Drohne in BVLOS. flynex.io, 2021.
- Commercial UAV News and Pickdrones. FAA Part 108 BVLOS rule under OIRA review since July 10, 2026. pickdrones.com, September 2026.
- VISORIC field projects in digital twins, real-time 3D, Gaussian Splatting and spatial computing.
- XR Stager platform for real-time 3D, digital twins, Knowledge AI and industrial spatial computing applications.
Contact Us:
Email: info@xrstager.com
Phone: +49 89 21552678
Contact Persons:
Ulrich Buckenlei (Creative Director)
Mobil +49 152 53532871
Mail: ulrich.buckenlei@xrstager.com
Nataliya Daniltseva (Projekt Manager)
Mobil + 49 176 72805705
Mail: nataliya.daniltseva@xrstager.com
Address:
VISORIC GmbH
Bayerstraße 13
D-80335 Munich