

More than 29,000 objects are currently verifiably orbiting Earth, each one captured by a global radar network, classified by AI systems, and displayed in a live, continuously updated 3D model. Not a simulation, not a rendering, but the actual, second-by-second updated position of everything currently moving through low Earth orbit.
Visualization: live 3D map of Earth’s orbit with thousands of color-coded objects, active satellites in green, rocket bodies and debris in red, hovering above the globe, in the foreground a single highlighted object with an overlaid catalog number and orbital data | Image: © Ulrich Buckenlei | XR Stager Online Magazine | VISORIC GmbH
In early 2026, researchers published a measurement tool called the CRASH Clock. It describes how much time the orbit would have after an initial collision before debris multiplies uncontrollably, a chain reaction known as the Kessler syndrome. The result is sobering and concrete: in 2018, this safety buffer still stood at 164 days, by 2025 it had shrunk to just 5.5 days. According to a filing with the US regulator FCC, SpaceX alone had to carry out around 300,000 automated collision-avoidance maneuvers for its Starlink network in 2025.[1]
The California-based company LeoLabs makes this exact problem visible, with Artificial Intelligence as a central building block. Through a global network of ground-based radar stations, LeoLabs continuously tracks more than 29,000 objects in low Earth orbit, satellites, rocket bodies, and debris fragments, while AI systems automatically classify the millions of daily measurement points and condense them into a live, publicly accessible 3D visualization. What used to be an abstract figure in a government report becomes, in this system, a navigable, permanently viewable digital representation of the entire near-Earth orbit.[2]
What stands out here as an impressive live visualization is technically precise and already well documented in the scientific literature. The combination of global radar coverage, AI-powered object classification, and real-time 3D rendering delivers a situational picture today that, until a few years ago, was reserved exclusively for military surveillance systems.
For spatial computing and digital twins, this is more than a spectacular image from space. It exemplifies how the principle of the digital twin, capturing physical reality in real time, processing it, and visualizing it in an understandable way, can be applied at the largest conceivable scale.
- CRASH Clock: buffer before a collision chain is shrinking fast.
- Starlink alone ran about 300,000 avoidance maneuvers in 2025.
- LeoLabs tracks over 29,000 objects via radar.
- Data flows live into a 3D visualization.
- Same principle as any industrial digital twin.
This article explains how a digital twin of Earth’s orbit works technically, what research reveals about its limits, which industries already depend on it today, and why the same principle matters far beyond space itself.
From Flying Blind to a Live Map of Orbit
For over six decades, Earth’s orbit was documented mostly after the fact. Ever since the first known breakup of a rocket upper stage in 1961, which created more than 200 pieces of debris, the official object catalog has grown steadily, maintained in the US by the Space Force’s 18th Space Defense Squadron based on orbital elements that are regularly recalculated and published.[3] Today, that catalog holds around 29,245 objects, of which only about 18,556 are active satellites, the rest is junk.[4]
The real problem for a long time was not a missing catalog, but its timeliness and accessibility. Orbital data was published periodically, not continuously, and was usually only available to operational users with a delay. For satellite operators, that meant: you roughly knew what was up there, but not in real time where exactly it was and how that intersected with your own orbits.
Making matters worse, the number of objects doesn’t grow linearly but in surges. Individual events such as fragmentations, collisions, or deliberate destruction tests have historically created thousands of new debris fragments in a single event. A catalog updated only every few days can barely capture such sudden jumps, let alone warn in time about the risks that result from them.

From static orbital element catalogs to a live-updated 3D view of orbit.
Infographic: evolution from a periodically published object catalog to continuous live visualization | Graphic: © Ulrich Buckenlei | XR Stager Online Magazine | VISORIC GmbH
This shift, from a periodically updated dataset to continuous live representation, fundamentally changes how reliable decisions in orbit can be. Instead of relying on snapshots that are already outdated by the time they’re applied, a dataset emerges that comes as close as technically possible to the actual, constantly changing state of the orbit.
For such live capture to work in practice, it requires sensor infrastructure that measures globally, independent of weather, and continuously. How this infrastructure is technically built is shown in the next chapter.
- Object catalog continuously expanded since 1961.
- Around 29,245 objects currently cataloged.
- Only about 18,556 of those active satellites.
- Orbital data traditionally periodic, not live.
- Fragmentations cause sudden growth spikes.
This makes clear that the real innovation lies not in simply counting objects, but in the speed and reliability with which new information flows into the overall picture. Only a system that captures this volatility in real time creates the basis for reliable operational decisions.
Why a Radar Network Suddenly Delivers a Digital Twin
That a system as dynamic as Earth’s orbit can be mapped in real time at all rests on a combination of global sensor coverage and automated data processing that has only become commercially available in the last few years.
The foundation is a globally distributed network of phased-array ground radars. LeoLabs now operates a proliferated radar network covering the southern hemisphere, the northern hemisphere, and the equatorial belt, delivering position and movement data around the clock, independent of weather conditions, particularly in the southern hemisphere, where classic state-run sensor networks historically had large gaps.[5]
Raw radar measurements alone, however, would hardly be usable. It is the company’s proprietary Vertex platform that processes the millions of daily measurement points with AI-powered analytics into actionable information, including orbital predictions, object characterization, and automated anomaly detection. The result is delivered as a continuous product suite that ranges from pure collision warnings to support for military situational assessment.[6]
Notable here is the role AI plays in this process. It doesn’t just sort measurement values, it learns from patterns in individual objects’ behavior, detects unusual orbital changes, and suggests where human attention is worth focusing, rather than weighting every one of the millions of measurements equally. This pre-sorting is exactly what turns a flood of data into a manageable situational picture.
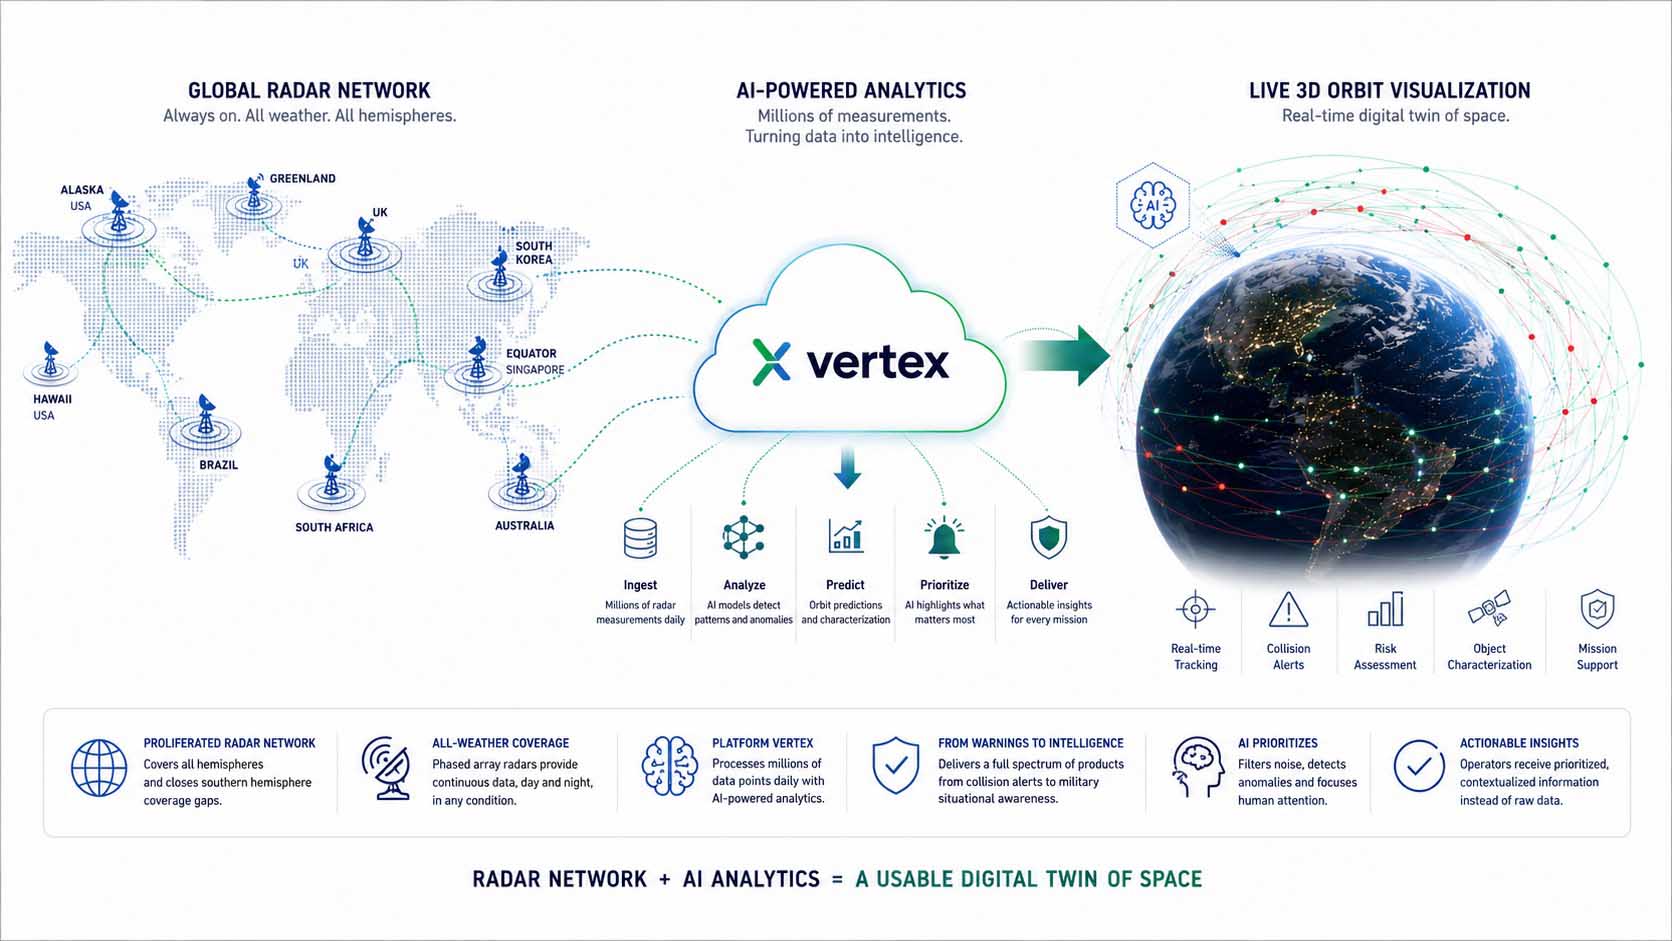
A radar network plus AI analytics together create a usable digital twin.
Infographic: from global radar network through AI analytics to live 3D visualization | Graphic: © Ulrich Buckenlei | XR Stager Online Magazine | VISORIC GmbH
Notably, this principle doesn’t rely on a single technology but on the interplay of several layers: sensors deliver raw data, AI analytics condense it into insights, and 3D visualization makes the result genuinely graspable for people. It is this three-part principle, not the individual radar installation, that forms the actual technological core.
This live capture, however, is only half the story. How individual measurement series turn into a lasting, reusable digital model is shown in the next chapter.
- Proliferated radar network covers every hemisphere.
- Southern hemisphere gaps are specifically closed.
- Vertex platform processes millions of points daily.
- Outputs range up to military situational assessment.
- AI pre-sorts measurements by relevance.
For operators, this means in practice that they no longer have to work through unstructured raw data, but instead receive already prioritized, contextualized information. This AI-driven preprocessing is the decisive step that turns a pure sensor network into a genuinely operationally usable system.
Digital Twins Preserve What Never Stops Moving
A single snapshot of orbit is informative. Its real value, however, only emerges once it becomes a continuous, constantly updated model, a true digital twin in the established sense of the term.
Current research is working precisely on this transfer. A study published in 2024 adapts, for the first time, the industry standard ISO 23247, originally developed for digital twins in manufacturing, to collision avoidance in low Earth orbit, and derives from it a formal framework for detecting objects below the ten-centimeter threshold, the range that remains hardest to capture today.[7]
Another line of research goes a step further and transfers the digital twin principle to entire satellite constellations. A recent framework for so-called Digital Twin Satellite Networks connects the physical satellite network with a synchronized virtual representation that combines real-time telemetry with predictive analytics to detect disruptions early and respond automatically.[8]
What’s interesting about both research strands is that they arrive independently at the same conclusion: a digital twin is only complete once it describes not just what is happening now, but also what is likely to happen next. This predictive component is what distinguishes a true digital twin from a mere snapshot.
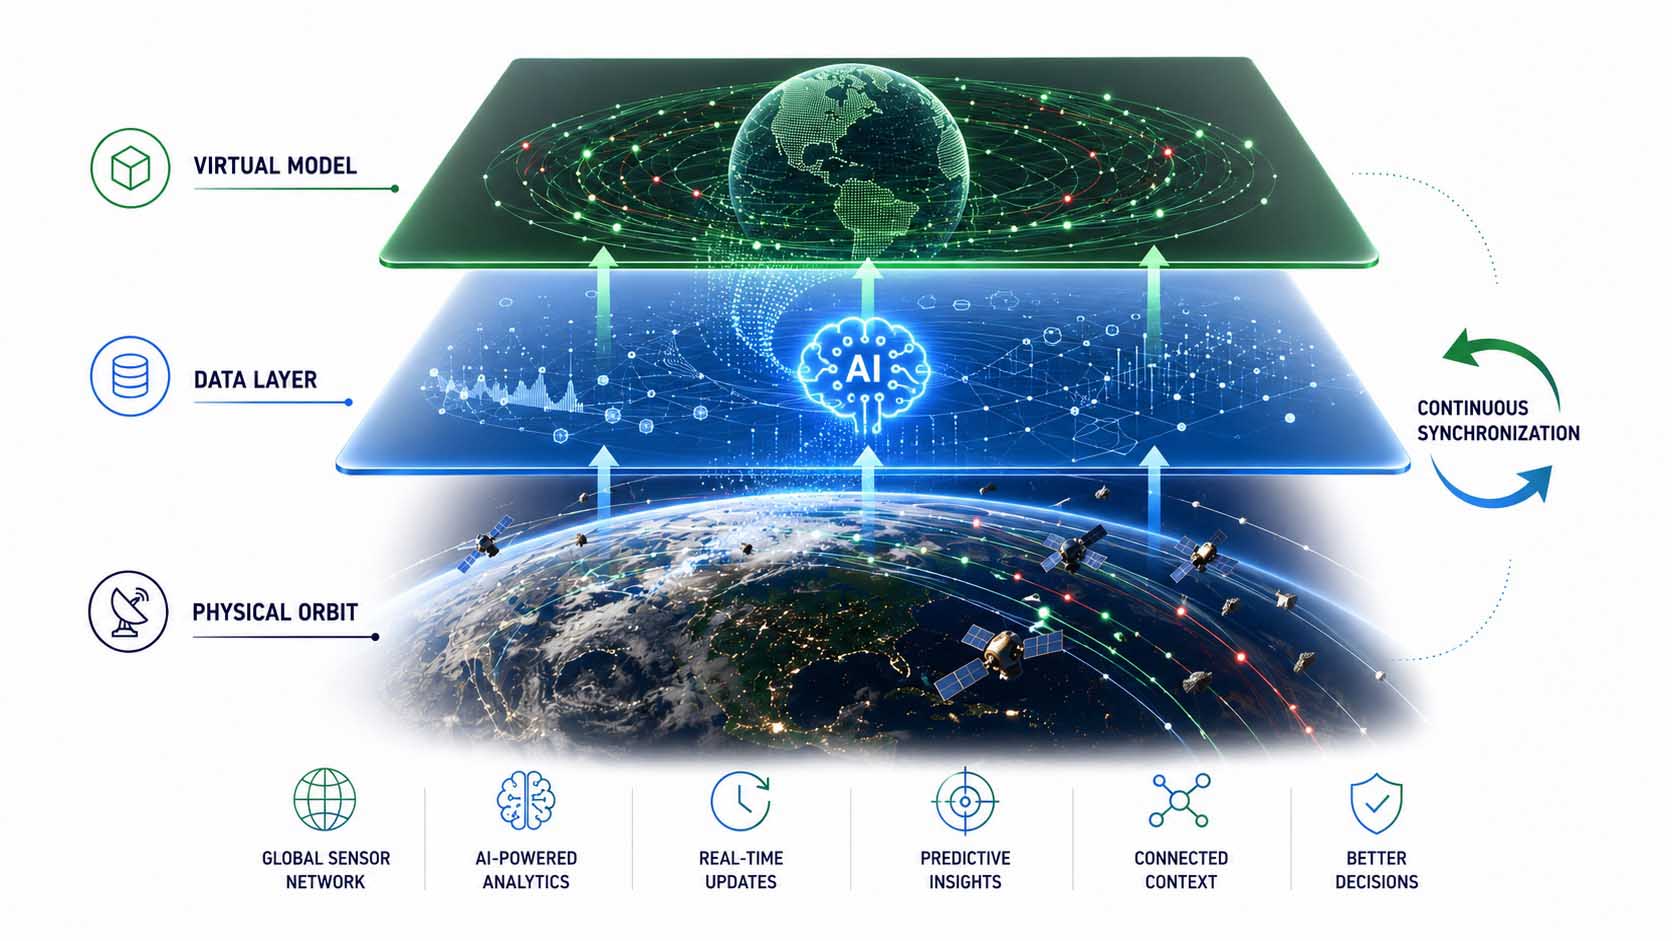
A digital twin only emerges through continuous synchronization.
Infographic: from single scan to a synchronized digital twin model of Earth’s orbit | Graphic: © Ulrich Buckenlei | XR Stager Online Magazine | VISORIC GmbH
For operators of large satellite fleets, this means a fundamental shift. Instead of isolated, individual orbit calculations, a continuously growing, searchable situational picture emerges, becoming more precise with every new radar measurement. A digital twin of orbit thus stops being a one-time snapshot and becomes a living, continuously updated representation.
For such a model to remain operationally reliable, it must be clear what it can actually deliver and where its limits lie. This important distinction is the subject of the next chapter.
- ISO 23247 adapted for collision avoidance for the first time.
- Digital Twin Satellite Networks synchronize entire fleets.
- Predictive component sets a twin apart from a snapshot.
- Model grows more precise with every new reading.
- Single measurements become a living representation.
This continuous refinement is also why a digital twin never reaches a finished state. It remains a process, not a product, which in turn explains why the next question must be exactly where that process hits its limits.
Why the Map Shows What Was, Not What’s About to Happen
As impressively precise as the live visualization appears, it has an important, often overlooked limitation: orbital predictions become rapidly less reliable as the time gap since the last measurement grows, mainly due to hard-to-predict effects such as atmospheric drag.
Operational practice openly acknowledges this exact limit. NASA’s own Conjunction Assessment Risk Analysis service, CARA, only issues warnings for low Earth orbit a maximum of seven days before the calculated next close approach, because longer-range predictions are simply no longer reliable enough given position and velocity uncertainties, and even within that window, unexpected solar storms can shift the situation on short notice.[9]
This uncertainty leads to a further effect in practice: the vast majority of reported close approaches ultimately turn out to be false alarms. Satellite operators therefore only maneuver once the calculated collision probability crosses a defined threshold, often a ratio of one in ten thousand, because too tight a safety margin would paralyze operational capability.[10]
This trade-off between caution and operational capability is not a purely technical problem, but a constant economic decision. Every unnecessary maneuver burns fuel, shortens a satellite’s lifespan, and ties up personnel who could otherwise be deployed more productively. The art lies in calibrating the threshold so that real risks are caught without getting lost in the noise of false alarms.
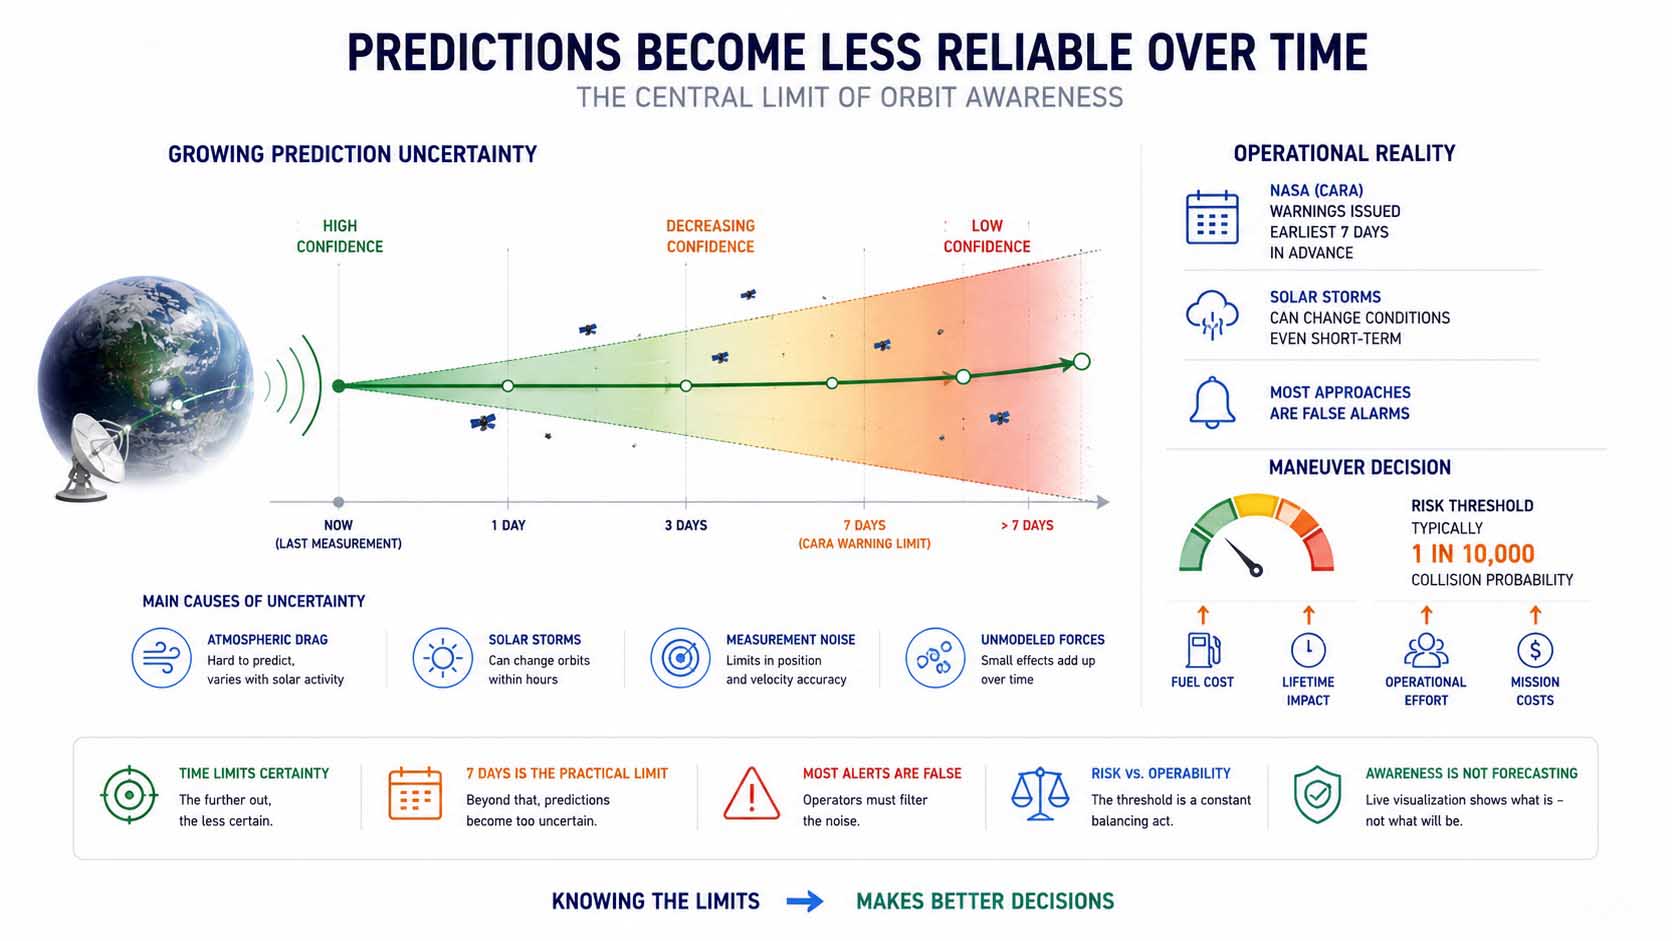
Predictions grow steadily less certain the further out they reach.
Infographic: growing prediction uncertainty over time as the central limit of orbit tracking | Graphic: © Ulrich Buckenlei | XR Stager Online Magazine | VISORIC GmbH
These limitations are not a reason to question the technology, they are a reason to place it correctly. A live visualization of orbit does not replace a perfect forecast of the future, but it does reliably replace the previous alternative: outdated, incomplete, or simply nonexistent situational pictures.
Anyone who knows this limit can realistically assess the technology and deploy it exactly where it makes the biggest difference. Which industries are already doing so today is shown in the next chapter.
- Predictions grow less certain over time.
- NASA warns at the earliest seven days ahead.
- Solar storms shift even short-term forecasts.
- Most reported approaches turn out to be false alarms.
- Maneuvers only begin past a defined risk threshold.
Anyone who understands these limits also understands why the next development steps don’t aim for still more raw data, but for better interpretation of the data already available. This is exactly where the industries at the center of the next chapter come in.
A Technology for Operators, Insurers, and the Military
Once it’s clear what a digital twin of orbit can deliver and where its limits lie, its practical value can be pinpointed: everywhere economic or security-relevant decisions depend on the position of moving objects.
For satellite operators, the benefit is immediately tangible. Large constellation operators now spend several million US dollars annually on collision avoidance per thousand satellites, and insurers increasingly require mandatory space traffic management subscriptions for fleets above certain sizes as a condition of coverage.[11]
The insurance industry itself is also visibly responding to growing uncertainty in orbit. The global space insurance market is set to grow to around 4.43 billion US dollars in 2026, driven by rising launch numbers and a simultaneously rising collision risk that underwriters increasingly calculate using telemetry and launch-history data instead of rough estimates.[12]
For the military and government agencies, another dimension comes into play that goes beyond pure collision avoidance. A reliable situational picture makes it possible to detect unusual behavior by foreign objects early, such as unexpected orbital changes that might indicate military activity rather than routine operations. Space domain awareness is thus increasingly becoming part of security-policy situational assessment, not just civilian traffic safety.
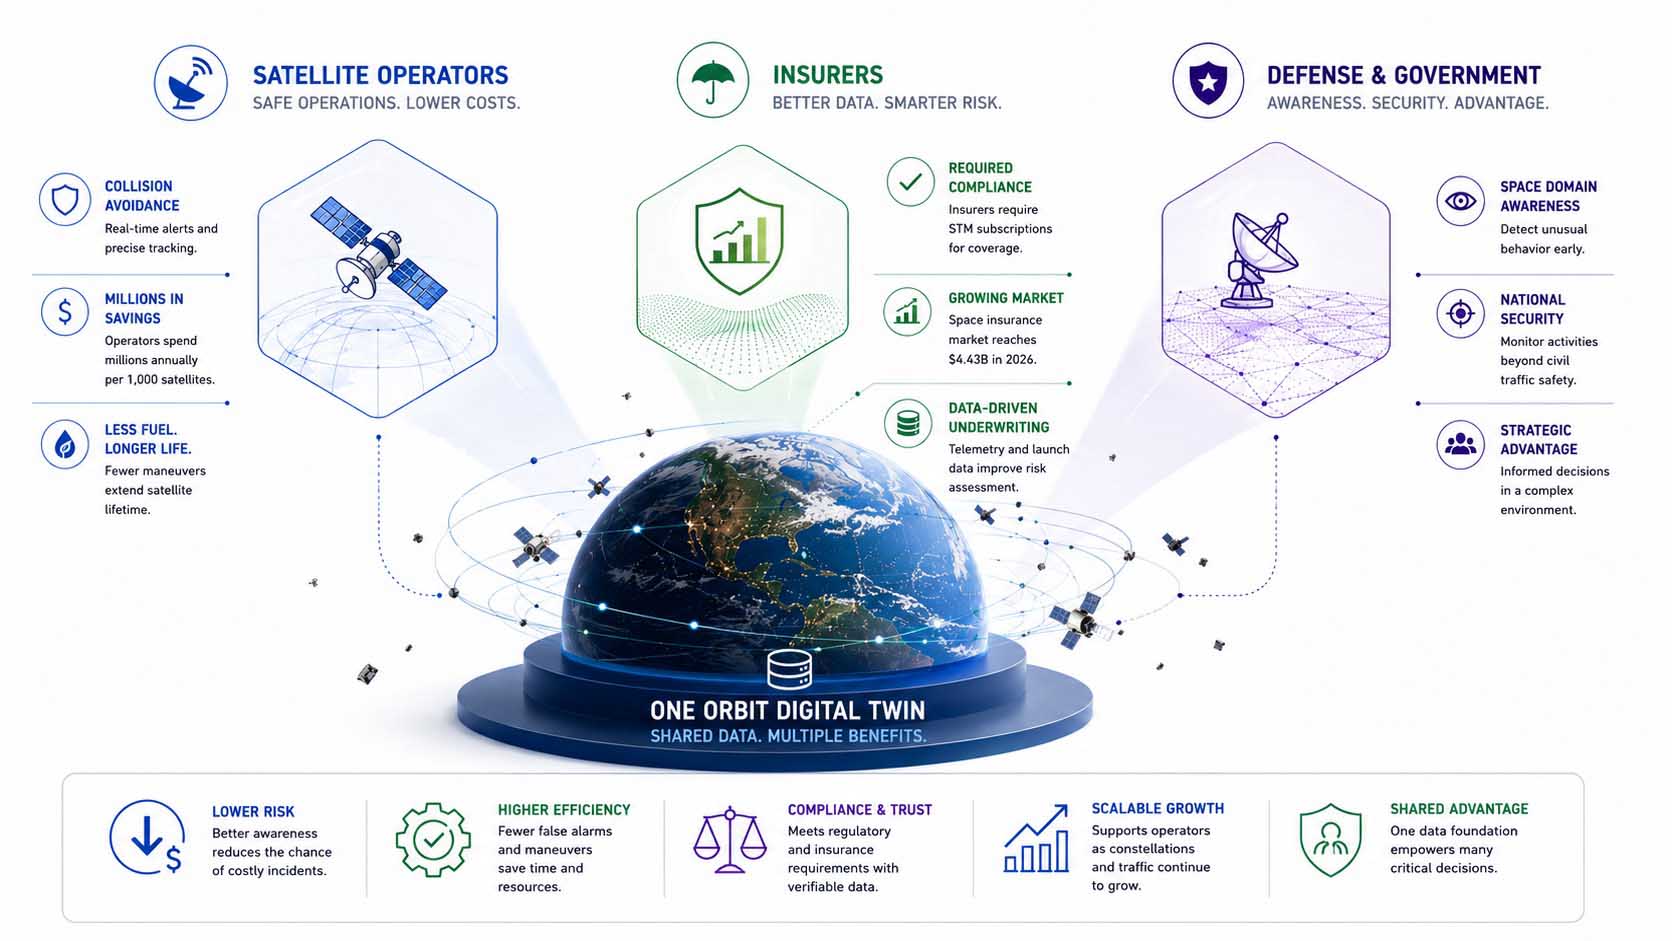
Satellite operations, insurance, and security policy all draw on the same data.
Infographic: application fields of the orbit digital twin across satellite operations, insurance, and security policy | Graphic: © Ulrich Buckenlei | XR Stager Online Magazine | VISORIC GmbH
Common to all these applications is one central advantage: a reliable, current situational picture reduces unnecessary maneuvers, lowers operational costs, and at the same time creates the traceability that insurers and regulators increasingly demand. For operators with growing fleets, that’s a double win, less risk alongside lower operational effort.
This range of applications raises an obvious question: how long does the human remain the decisive authority, and at what point does Artificial Intelligence take over the actual decision? That’s exactly what the next chapter is about.
- Constellation operators pay millions for collision avoidance.
- Insurers demand mandatory STM subscriptions.
- Space insurance market grows to $4.43B in 2026.
- Underwriters increasingly calculate risk from data.
- Military uses the picture for security assessment.
The more parties draw on the same data foundation, the more important the question of speed becomes. A situational picture that humans can only evaluate with delay loses value at precisely the most critical moments, and that leads directly to the next stage of development.
When AI Analytics Ushers in the Next Step
A precise, continuously updated situational picture is an excellent foundation, yet, as shown in chapter 4, it remains laden with uncertainty. The next logical development step lies in connecting this foundation with automated decision-making, rather than continuing to make every maneuver decision manually.
This direction is already emerging clearly in both research and operational practice. AI systems that sort warnings by collision probability, weigh the cost of a maneuver against the risk, and coordinate maneuvers across multiple satellites are no longer an experimental add-on, they have become an operational necessity for fleets facing hundreds of monthly conjunction alerts.[13] In parallel, current research is exploring how reinforcement learning can enable satellites to independently plan and execute avoidance maneuvers under incomplete information, without waiting for a ground command at all.[14]
The decisive advantage lies in response time. While a ground command can take several hours depending on the contact window, an onboard AI system responds within seconds. For a constellation of thousands of satellites that may need to react to several warnings simultaneously, this speed becomes a critical safety factor, not merely a convenience.
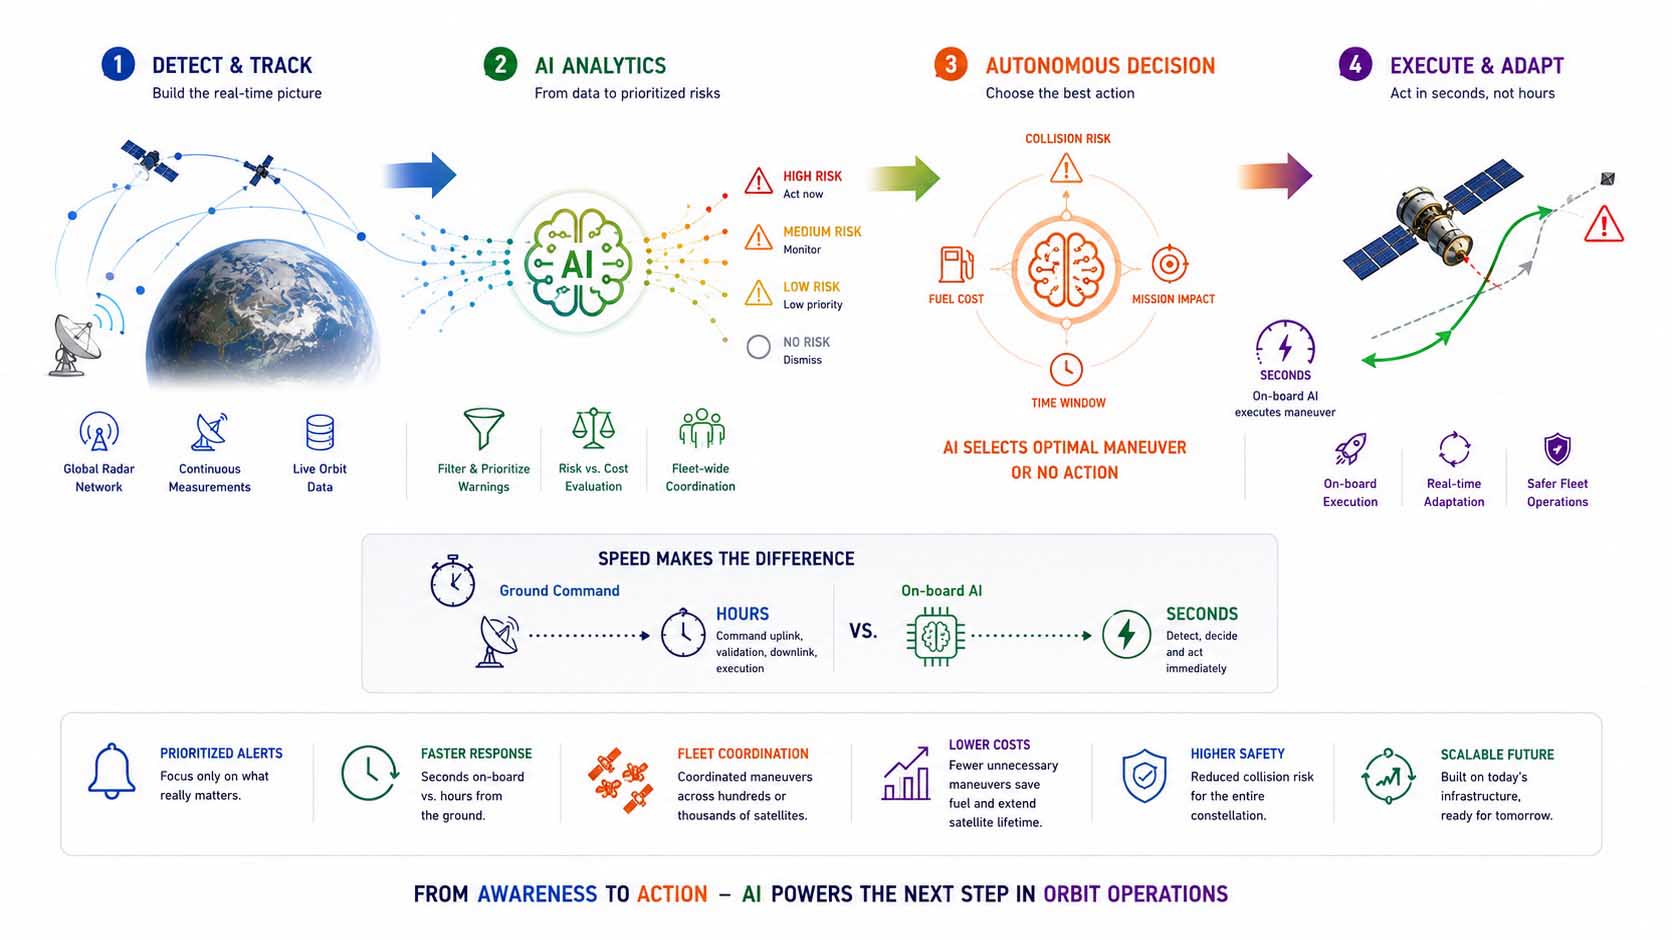
AI sorts warnings and increasingly takes over the maneuver decision itself.
Infographic: from pure situational awareness to automated, AI-driven maneuver decisions | Graphic: © Ulrich Buckenlei | XR Stager Online Magazine | VISORIC GmbH
For operators of large constellations, the effect would be substantial. Instead of a situational picture that merely shows where a risk exists, a system would emerge that also independently assesses when action is required and initiates the necessary response, coordinated across an operator’s entire fleet.
This step, from pure situational awareness to automated decision-making, is technically demanding but by no means science fiction. It builds directly on already established tracking technology and shows where the entire space-surveillance industry is currently heading. Just how open and dynamic this field really is becomes clear in the next chapter.
- AI automatically sorts warnings by risk.
- Reinforcement learning explores independent maneuver planning.
- Onboard AI responds within seconds.
- Ground commands can instead take hours.
- Automation builds on established tracking capability.
This speed is also the reason the field is evolving so quickly right now. What was once reserved exclusively for government programs is increasingly becoming a tool that can be purchased commercially and deployed directly.
From Specialized Radar to an Everyday Tool
Just a few years ago, monitoring Earth’s orbit was reserved almost exclusively for government defense programs, closed radar networks, classified catalogs, no public access. Current market analyses show that this picture has fundamentally changed by 2026.
Space situational awareness is increasingly evolving from a specialized defense function into a core building block of safe, economically scalable space use. Growing constellations, rising debris loads, and a growing need for trustworthy space-traffic coordination are driving demand for precise tracking and predictive risk analytics across the entire industry.[15] The market for sensors and software in this field is projected to grow from around 1.98 billion US dollars in 2026 to more than 4.5 billion US dollars by 2036, with a rising share of commercial rather than purely military demand.[16]
This commercialization is also changing who has access to such data in the first place. Where only a handful of government agencies once held a complete situational picture, mid-sized satellite operators, research institutions, and even individual developers can now access comparable data through open APIs. This democratization is itself a major driver of market growth.
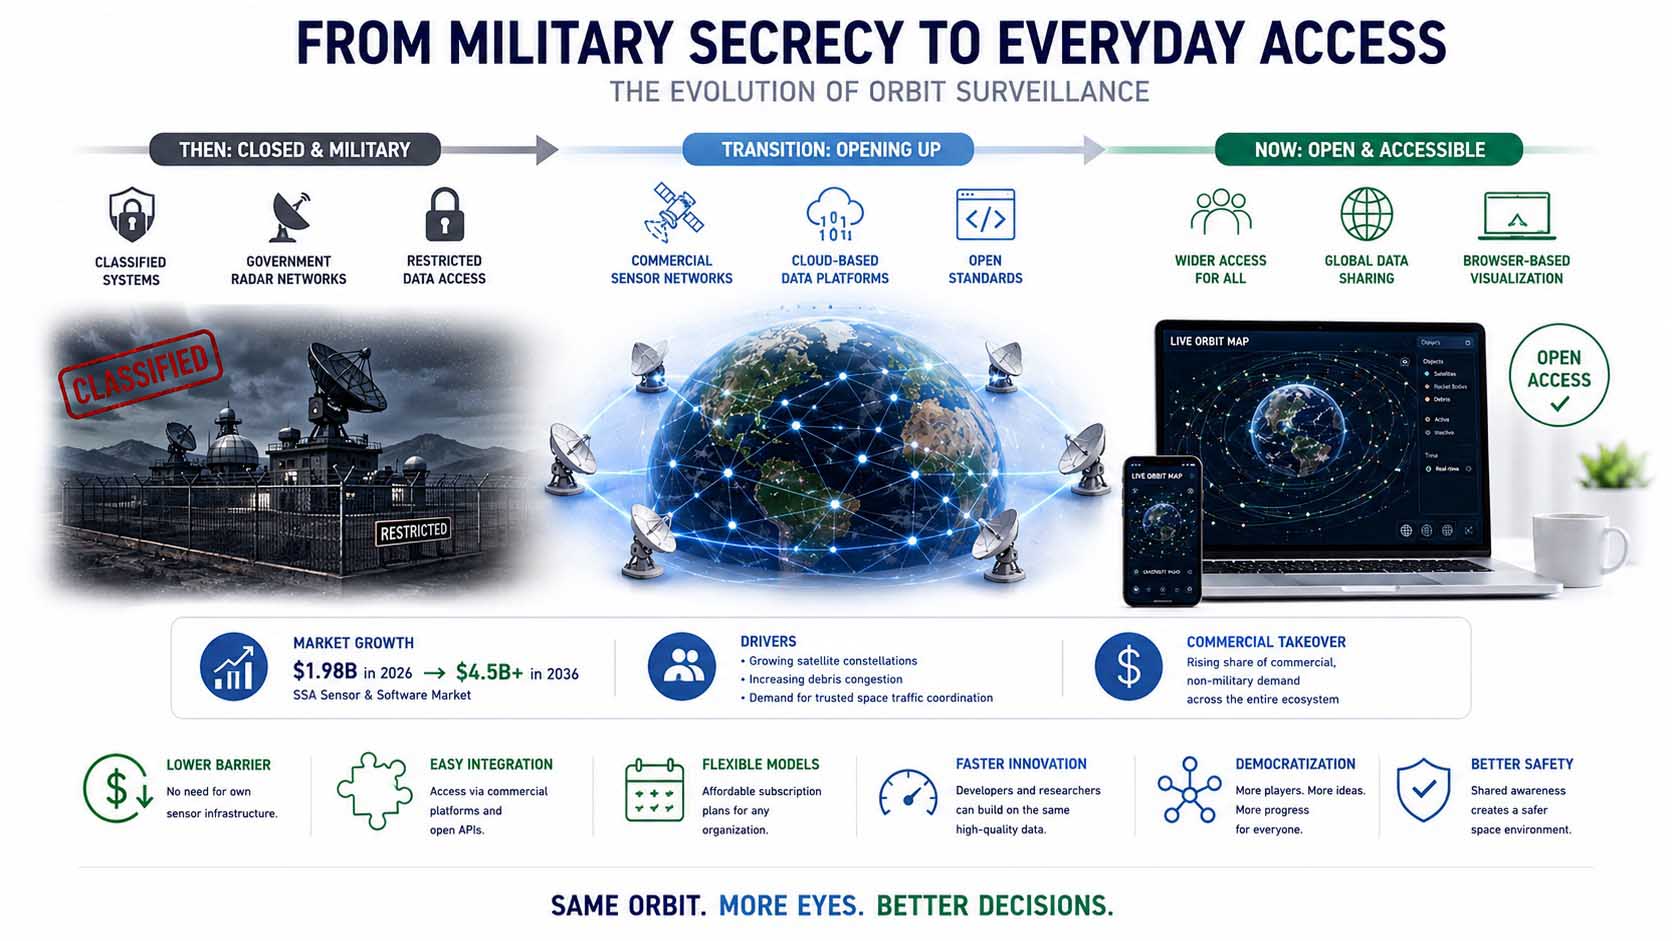
What was once military is now viewable through any browser.
Infographic: evolution from closed military technology to publicly accessible orbit monitoring | Graphic: © Ulrich Buckenlei | XR Stager Online Magazine | VISORIC GmbH
For companies, this development means a noticeably lower barrier to entry into a demanding technology. Instead of having to build their own sensor infrastructure, precise situational pictures can now be integrated directly through commercial platforms and open APIs, backed by comparatively accessible subscription models.
At the same time, this development shows how progress in space surveillance unfolds overall: not through a single technological breakthrough, but through the growing openness and commercialization of already existing capabilities. How this development fits into the bigger picture of the digital twin ecosystem is shown in the final chapter.
- Space monitoring was long walled off militarily.
- SSA is increasingly a commercial core capability.
- Market grows to $4.5B by 2036.
- Open APIs lower the entry barrier significantly.
- Democratization itself drives market growth.
This openness is more than a purely market-driven trend, it also changes who is even in a position to plan and work with this technology. That very shift leads to the final, larger question of this article.
The Orbit Twin as the Next Stage of the Digital Twin Ecosystem
The previous chapters have shown how a digital twin of Earth’s orbit works technically, what accuracy it achieves, where its limits lie, and which industries already rely on it today. Together, these building blocks form a principle that reaches far beyond space itself.
Current industry analyses confirm what this article has already outlined: digital twins are evolving across every industry from pure visualization into systems that tightly connect real-time sensor data, AI analytics, and 3D rendering. The market for digital twin platforms alone is projected to grow to more than 73 billion US dollars by 2027, driven by exactly this convergence of sensors, AI, and spatial representation.[17]
For digital twins in general, this marks an important extension. The integration of AI, IoT, and cloud computing is increasingly turning static digital models into dynamic, data-driven systems, a pattern that current industry reports find everywhere from urban traffic platforms to industrial command centers, LeoLabs simply applies the same principle at the largest possible scale, the entire near-Earth orbit.[18]
The real value of this example lies in the fact that it proves the scalability of the principle. If a system with 29,000 fast-moving, physically inaccessible objects can be reliably mapped in real time, the argument that one’s own operations are too complex or too unpredictable for this loses its force.
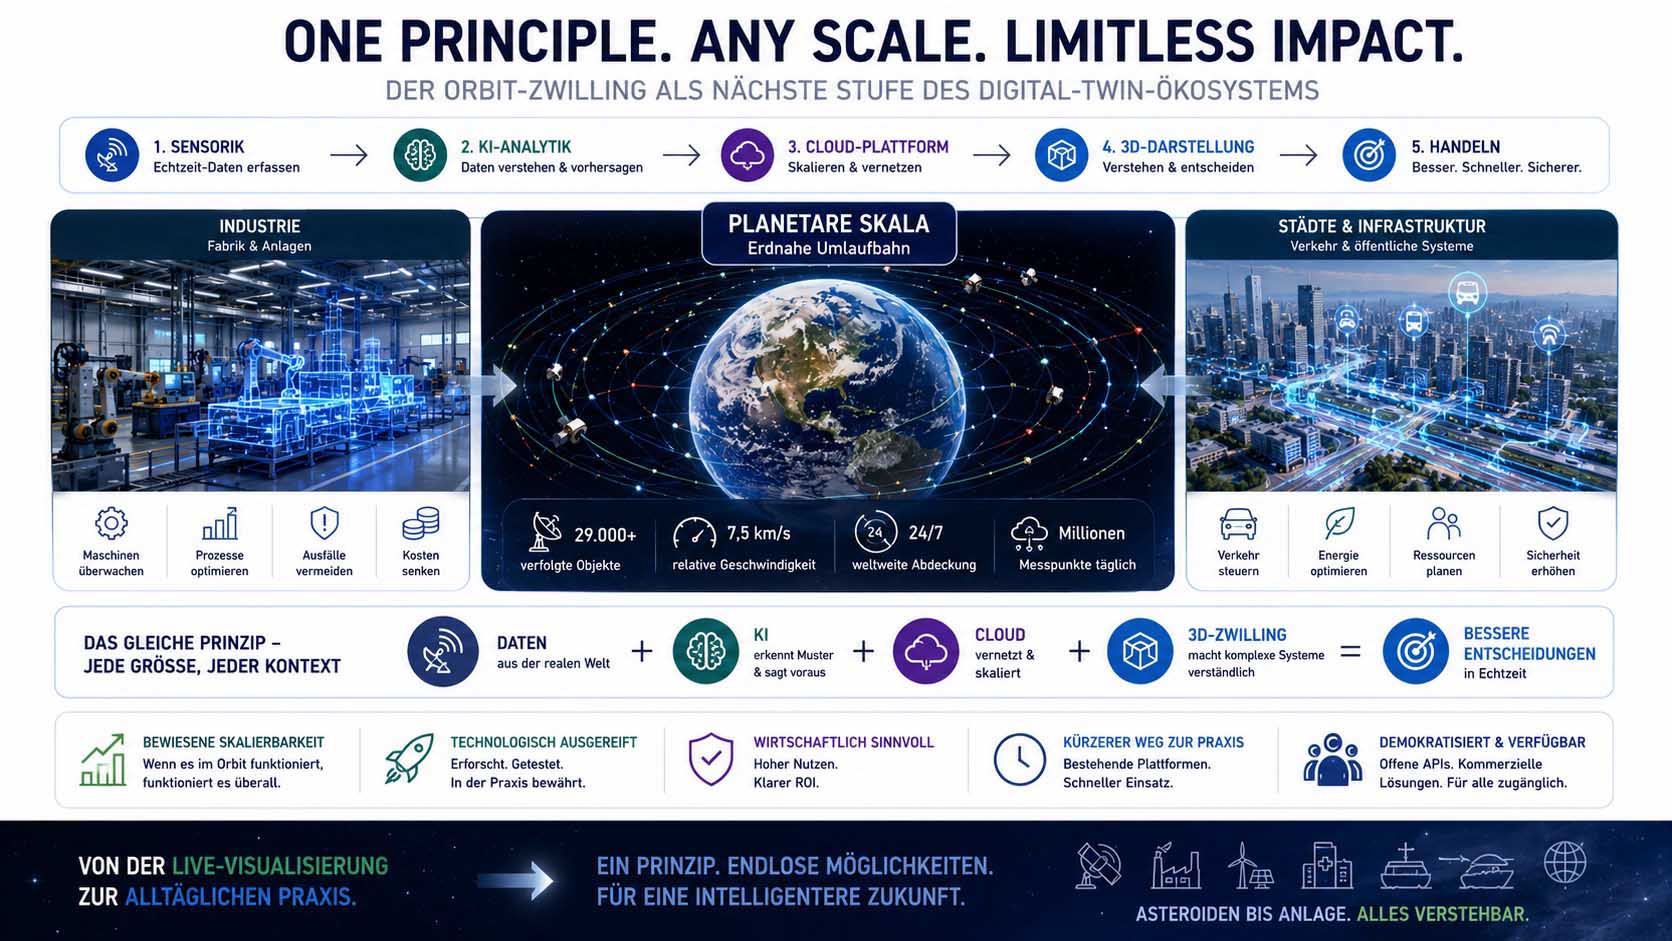
Factory floor, city, or orbit, the same principle makes complex systems understandable.
Infographic: the orbit digital twin as a planetary-scale application of the same principle behind industrial digital twins | Graphic: © Ulrich Buckenlei | XR Stager Online Magazine | VISORIC GmbH
For companies investing in digital twins and spatial computing, a clear strategic consideration follows from this. If even 29,000 objects moving at seven and a half kilometers per second can be reliably mapped in real time, the question for every company becomes which part of its own, far slower and smaller operational reality is still being managed without its own digital twin.
Research and broad commercial adoption show that this capability is already technically mature, scientifically validated, and commercially viable today. The path from an impressive live visualization of Earth’s orbit to everyday, company-wide practice is therefore, for companies that act now, considerably shorter than it appears at first glance.
- Digital twins are becoming increasingly data-driven.
- Market grows to over $73B by 2027.
- AI, IoT, and cloud turn static models dynamic.
- The orbit twin proves the principle scales.
- The path to practice is now much shorter.
This closes the circle of this article. What begins with the desire to make 29,000 fast-moving objects understandable evolves into a foundational principle for the next generation of digital twins, far beyond space itself. Just how convincing this principle already looks in practice is shown in the video below.
When an Entire Planet Gets Its Digital Counterpart
The previous chapters have shown how the digital twin of Earth’s orbit works technically, what accuracy it achieves, and where its limits lie. Just how convincing this principle already looks in practice is most striking when looking directly at the live visualization itself.
The video below shows LeoLabs’ publicly accessible 3D visualization: thousands of color-coded objects, active satellites, rocket bodies, and debris, orbit the Earth in real time, each one clickable and tagged with a catalog number and object name.[2] Especially telling is that this same live map can be opened publicly in a browser and explored independently at any time.
This moment, making an invisible, complex system understandable at a glance, illustrates in an instant what the previous chapters explained technically: physical reality moves too fast and is too complex for the human eye, precisely captured digital information makes it graspable.
Video: live 3D visualization of Earth’s orbit tracking over 25,000 objects | Visuals by original creators LeoLabs, Menlo Park, California | Clip shared and narrated by content creator @alexdvizhnov | Analysis, script, editing, and video production: © Ulrich Buckenlei | XR Stager Online Magazine | VISORIC GmbH
The video makes clear that precise orbit monitoring is no distant future concept, but already works today, publicly accessible, directly in a browser, without specialist staff and without any waiting time. For companies considering their own digital twin of their physical operations, this example shows just how close a practical implementation already is.
At the same time, the video reveals the decisive conceptual difference: it’s not the individual visualization that’s remarkable, but the fact that the same information is continuously, reliably, and verifiably kept up to date. That is exactly what turns an impressive recording into a reliable operational tool.
- Video shows the public live 3D visualization.
- Every object is individually clickable and tagged.
- The live map can be freely explored in-browser.
- The technology works without specialist staff.
- Continuous updating is what matters most.
This example makes tangible where digital twins are heading: from an impressive live demonstration to a reliable, lasting representation of everything that actually moves around us, above us, or within our own facilities.
From Idea to Your Own Digital Twin
A reliable digital twin doesn’t come from a single piece of software or a single data source, but from the thoughtful interplay of suitable sensors, fitting AI analytics, and real-time 3D visualization that genuinely makes complex relationships understandable. This exact combination is at the core of what VISORIC develops for its clients.
The expert team at VISORIC GmbH in Munich combines over 15 years of experience in 3D, AI, and XR with hands-on experience in digital twins, real-time 3D, and spatial computing, exactly the building blocks a reliable digital representation requires, whether it’s a production line, a building, a vehicle fleet, or an entire network of facilities. VISORIC builds the technical bridge from data capture all the way to a permanently usable digital twin, tailored to a company’s actual requirements.

15 years of experience in 3D, AI, and XR: the VISORIC expert team from Munich.
Image: © Ulrich Buckenlei | XR Stager Online Magazine | VISORIC GmbH
A well-thought-out pilot project, a single facility, a single fleet, a single site, can often be realized considerably faster and more cost-effectively than many companies expect. VISORIC accompanies this path from the first concept through the technical capture strategy to a fully operational, permanently usable digital twin.
- Design of digital twins for industry and infrastructure.
- Integration of real-time sensor data and AI analytics.
- From pilot project to company-wide digital twin.
That is exactly the right starting point for a conversation: not the big, company-wide vision, but a clearly scoped, quickly implementable first step that shows how the principle translates to your own operational reality.
Do you want to precisely capture complex, constantly changing systems, facilities, fleets, or sites, and represent them permanently in a digital twin?
Talk to the VISORIC expert team in Munich about digital twins, real-time 3D, and modern spatial computing platforms. Together, we’ll turn your requirements into a precise, permanently usable digital representation, with a tangible advantage in decision speed, safety, and traceability.
Contact:
Email: info@visoric.com
Phone: +49 89 21552678
Sources and References
- The $6 billion space insurance market faces its biggest stress test yet. Insurance Business Magazine, June 2026.
- LeoLabs. Public live 3D visualization of Earth’s orbit, platform.leolabs.space/visualization. Clip shared by content creator @alexdvizhnov.
- A Brief History of Space Debris. The Aerospace Corporation.
- Space Debris Statistics 2026: How Many Objects in Orbit? OrbitalRadar.
- Space Domain Awareness, Persistent Orbital Intelligence. LeoLabs.
- LeoLabs Launches Delta: The Most Comprehensive Space Domain Awareness Solution. PRNewswire, April 2026.
- Adaptation of ISO 23247 to Aerospace Digital Twin Applications, On-Orbit Collision Avoidance. MIT DSpace, 2024.
- Digital Twin Satellite Networks: A Paradigm for Intelligent, Efficient, and Resilient Operations. arXiv.
- NASA Conjunction Assessment Risk Analysis (CARA) Compendium. NASA Technical Reports Server.
- What Is Conjunction Assessment? Collision Screening. OrbitalRadar Glossary.
- Space Traffic Management Market Size, Trends, Forecast 2033. Astute Analytica.
- The $6 billion space insurance market faces its biggest stress test yet. Insurance Business Magazine, June 2026.
- AI as Mission Control: How Autonomous Satellite Operations Are Changing the Ground Segment. New Space Economy, March 2026.
- Spacecraft Autonomous Decision-Planning for Collision Avoidance: a Reinforcement Learning Approach. arXiv.
- Space Situational Awareness Market Intelligence Report. 360iResearch, June 2026.
- Space Domain Awareness (SDA) Sensors & Software Market, Opportunity Analysis 2026-2036. Meticulous Research.
- Spatial Computing Statistics 2026: Growth Trends and Market Data. TechRT, May 2026.
- Spatial Computing Industry Research Report 2026. GlobeNewswire, February 2026.
- VISORIC case studies in digital twins, real-time 3D, and spatial computing.
- XR Stager platform for real-time 3D, digital twins, Knowledge AI, and industrial spatial computing applications.
Contact Us:
Email: info@xrstager.com
Phone: +49 89 21552678
Contact Persons:
Ulrich Buckenlei (Creative Director)
Mobil +49 152 53532871
Mail: ulrich.buckenlei@xrstager.com
Nataliya Daniltseva (Projekt Manager)
Mobil + 49 176 72805705
Mail: nataliya.daniltseva@xrstager.com
Address:
VISORIC GmbH
Bayerstraße 13
D-80335 Munich