A single digital design model forms the foundation for a wide range of industrial applications, from technical documentation and simulation to photorealistic visualization and immersive XR experiences.
Visualization: © Visoric Research Lab 2025 | Symbolic representation of the multiple reuse of a CAD-based product model
Digital design data has long since become more than a mere working basis for engineering teams. What once primarily served internal development has evolved into a strategic asset for companies. A precisely constructed CAD model can be used, interpreted, and expanded throughout its entire lifecycle, long before a product physically exists and far beyond the moment of manufacturing.
This is not about a new technology, but about a change in perspective. Those who no longer see CAD data as an isolated design artifact, but as a central source of reliable product truth, create the foundation for end-to-end digital processes. This is exactly where the transformation of CAD data into multifunctional digital assets begins.
The central image of this chapter captures the essence of modern product visualization. On the left, a component appears as a CAD representation with color coded surfaces, clear segmentation, and a visible construction grid. This side speaks the language of development. Geometry, radii, transitions, and volumes do not stand for design, but for technical truth. Every surface is calculated, every edge defined, every form reproducible. On the right, the same form transforms into a photorealistic product. Data becomes materials. Metals appear precise, clean, and industrially refined. A transparent section opens the view into electronics and mechanics, as if looking into a real enclosure. This transition is the core message. CAD data does not only provide the foundation for manufacturing, but increasingly also for communication, simulation, training, and XR applications. A single dataset can simultaneously ensure technical accuracy and allow virtually unlimited visual interpretation. Visualization: © Visoric Research Lab 2025 | Symbolic representation of the transformation from construction data to photorealistic product visualization This image represents a strategic shift in many companies. Construction data becomes digital assets usable across the entire value chain. Technical documentation requires correct dimensions and perspectives. Training requires comprehensible representations. Simulation requires clean geometry. XR applications require performant 3D assets. Marketing requires visual quality, variants, and consistency. When all these areas build on the same data foundation, friction and media breaks are reduced, while speed and scalability increase significantly. In the next chapter, we take a closer look at how this pipeline works in practice. It focuses on the key stages between CAD export, data preparation, material definition, and rendering, and explains why a single model can generate so many visual formats. The graphic at the center of this chapter shows the visualization pipeline in its clearest form. On the left side stands the origin: three-dimensional CAD construction data. These models contain the complete technical description of a product. Radii, wall thicknesses, drill holes, transitions, and tolerances are precisely defined. The color coded surfaces and visible construction grid make it clear that this is not about aesthetics, but about geometric truth. From there, the process leads into the so-called processing core. This area is the heart of the pipeline. Here, CAD data is prepared, simplified, structured, and readied for different target systems. Depending on the use case, topologies are optimized, components segmented, or variant logics defined. What matters is that the underlying geometry remains correctly intact, even when the model is adapted for visualization, real-time engines, or simulation. The next step introduces materials, surfaces, and textures. The yellow highlighted zone in the graphic clearly illustrates this transition. This is where decisions are made about surface behavior. Metallic or matte, painted or raw, transparent or opaque. Glass, plastics, coatings, and composite materials are defined in a physically plausible way so that light, reflections, and transparency respond realistically. This step is critical to ensure that the resulting images do not just look good, but feel credible. On the right edge of the graphic, the visual assets finally emerge. From the same dataset, photorealistic renderings, transparent cutaway views, technical exploded views, XR content, or cinematic product films can be generated. The geometry remains identical, only the interpretation changes. This is what makes the pipeline so powerful. One model, many representations, full control over consistency and quality. Graphic: © Visoric Research Lab 2025 | Simplified representation of an industrial CAD-to-visualization pipeline This pipeline explains why companies today can produce a wide range of visual formats with relatively little additional effort. It is the foundation that allows visualization to grow directly out of the technical data base instead of being created in isolation. In the next chapter, we take a closer look at the role of real-time technologies and game engines. This is where it becomes clear how this data is not only rendered, but experienced interactively, dynamically, and at scale. The central graphic of this chapter illustrates the next logical step in the evolution of industrial visualization. While CAD data and traditional rendering pipelines already enable a broad visual spectrum, their full potential unfolds only in real-time environments. The visualization therefore places a real-time engine at the center as a visual and technical control hub. On the left side of the graphic, structured CAD data flows into the engine. This data originates from the previously described pipeline and is already optimized, segmented, and materialized. The engine does not treat this data as a static model, but as a dynamic system. Geometry, materials, variant logic, and metadata are integrated in a way that allows them to be processed and modified in real time. At the core of the graphic lies the real-time rendering module. Here, photorealistic images are no longer generated as individual renders, but as continuously calculated scenes. Light, shadows, reflections, and transparency respond instantly to camera movement, parameter changes, or user interaction. This is where the decisive difference to classic offline rendering becomes visible. Visualization is no longer produced, it is experienced. On the right side, the system opens up to different output channels. The same scene can be used as an interactive product presentation, an XR application, a training simulation, or a configurable sales tool. Game engines such as Unreal Engine or Unity provide the technological foundation. Unreal is often used for the highest visual quality and cinematic presentations, while Unity is particularly strong in interactive applications, mobile scenarios, and industrial training environments. This ecosystem is increasingly complemented by specialized real-time frameworks and proprietary engines for specific industrial applications. Graphic: © Visoric Research Lab 2025 | Simplified architecture of a CAD-based real-time visualization using game engines Through this architecture, the role of visualization shifts fundamentally. It moves from a downstream communication step to an active component of digital products and processes. Visualization becomes controllable, scalable, and continuously expandable. In the next chapter, we look at how these real-time systems are increasingly enhanced by artificial intelligence. This reveals how variants, materials, and visual styles are no longer defined manually, but generated and controlled algorithmically. Real-time engines mark a decisive turning point in industrial visualization. Their full potential, however, only emerges when they are no longer purely deterministic, but augmented by artificial intelligence. At this point, the transition begins from fixed render pipelines to adaptive, learning systems that can make visual decisions based on context. The following graphic illustrates this next evolutionary step. It shows how precise construction data continues to form a stable foundation, while an AI layer above it decides how materials, variants, and visual styles are interpreted and output. Visualization is not replaced, but intelligently controlled. Source: VISORIC Research Lab | Conceptual system visualization, 2025 On the left side of the graphic, we see the deterministic inputs already familiar from previous chapters. CAD geometry, material definitions, lighting parameters, and camera settings form the technically accurate starting point. This data is exact, reproducible, and unchanged, representing the technical truth of the product. At the center of the illustration lies the decisive new layer: the AI style engine. Here, existing data is not reinvented, but interpreted. The AI analyzes geometry, material logic, and contextual information and makes decisions about surface appearance, style variants, and visual priorities. Material generation, variant logic, and context awareness work together to dynamically adapt visual results to target groups, platforms, or usage scenarios. On the right side, different outputs emerge from the same model. Photorealistic product visualizations, stylized marketing images, XR experiences, or simulations for digital twins are no longer separate production processes, but parallel expressions of the same system. The geometry remains identical, only its visual interpretation changes. This development fundamentally changes the role of visualization. Instead of producing individual images or assets, adaptive systems emerge that can generate, adapt, and scale visual content in real time. Companies are no longer building images, but visual intelligence. In the next chapter, we shift our focus to how these intelligent visualization systems are embedded into real-world usage scenarios. This reveals how users, environments, and systems interact with these dynamic representations in real time, creating new forms of product communication, training, and decision support. Intelligent visualization systems reveal their true value only when they are not viewed in isolation, but as an active component of real usage scenarios. Instead of static images, dynamic representations emerge that adapt to users, context, and situation. This is where visualization becomes a tool for communication, learning, and decision making. The central graphic shows how an intelligent visualization core acts as a connecting element between data, real-time systems, and real users. At the center is a CAD-based digital model that is continuously interpreted through AI-driven logic and a real-time engine. From there, different usage paths branch out, each with distinct requirements for representation, interaction, and context. Visualization: © Visoric Research Lab 2025 On the left side of the graphic, it becomes clear how product communication benefits from these systems. Sales and marketing teams work with exactly the same data as development and engineering. Products can be displayed, configured, and explained with rich variation, without technical inconsistencies. Visualization becomes a precise communication instrument. In the upper right area, training and education take center stage. Users interact directly with digital product representations, explore functions, processes, and maintenance steps in immersive environments. The decisive advantage is that content can dynamically adapt to learning progress and usage context. The lower area of the graphic shows simulation and decision support. Complex systems are analyzed, scenarios are explored, and impacts are visualized before real decisions are made. Here, visualization serves understanding, not aesthetics. In the lower right quadrant, service and field operations become visible. Technicians work with mobile devices or XR systems directly at the real object, while digital twins overlay context-aware information. Visualization becomes an operational tool in everyday work. These usage scenarios demonstrate that visualization today extends far beyond classic rendering. It becomes an active part of digital processes. The next logical step is the question of how these systems can be implemented not only interactively, but also with strong visual impact and emotional effectiveness. This is exactly where the following video comes in. The following video exemplifies how modern product visualization is created today. The starting point is a precise CAD model that describes the exact geometry of a product long before it physically exists. This data forms the foundation for all further visual interpretations. The video shows how a wide range of representations emerges from a single model. Photorealistic images, transparent X-ray views, wireframe models, or cinematic product sequences always rely on the same geometric truth. The data does not change, only its visual interpretation. The role of artificial intelligence is particularly evident. Materials, surfaces, and style variants can be generated in seconds without manual production chains. Precision is preserved while flexibility increases dramatically. Original material provided by the respective creators and curated via @the.factlab.us. Editing, voiceover, and iconographic composition: Ulrich Buckenlei. The video makes it clear that visualization today is no longer the end product of a process, but its visible surface. It connects engineering, communication, and decision making into a continuous system. This inevitably raises the question of how companies can strategically use such technologies and meaningfully integrate them into their processes. This is exactly where the final look at the Visoric expert team comes in. Professional visualization begins long before the first render. It starts with the structured preparation of construction data. The Visoric expert team in Munich specializes in transforming CAD data so that it remains technically accurate while becoming visually precise, photorealistic, and versatile in use. We translate industrial construction data into high-quality digital assets that go beyond classic visualization. Whether large-format print, product film, interactive web application, or real-time visualization on headsets such as Apple Vision Pro, Meta Quest, or other XR systems, the same data foundation is prepared to function consistently, scalably, and across media. Source: VISORIC GmbH | Munich 2025 A particular focus lies on the high-quality materialization of complex products. Transparency, glass, metals, coatings, and paints are implemented in a way that is physically credible and visually indistinguishable from photography or live-action film. The resulting assets can be used for marketing and communication as well as for simulation, training, and decision support. In addition to project-based implementation, we also advise companies on building their own visualization pipelines. This includes modular 3D workflows, AI-driven variant logic, and systems that enable teams to independently process their data at a high quality level, from prototype to digital twin. If you want to not only manage construction data, but use it strategically, we support you in developing robust digital assets from it. Often, an initial conversation is enough to clarify how existing data can be rethought, prepared, and transferred into powerful visualization systems. Contact Us: Email: info@xrstager.com Contact Persons: Nataliya Daniltseva (Projekt Manager) Address:
From construction data to a visual product
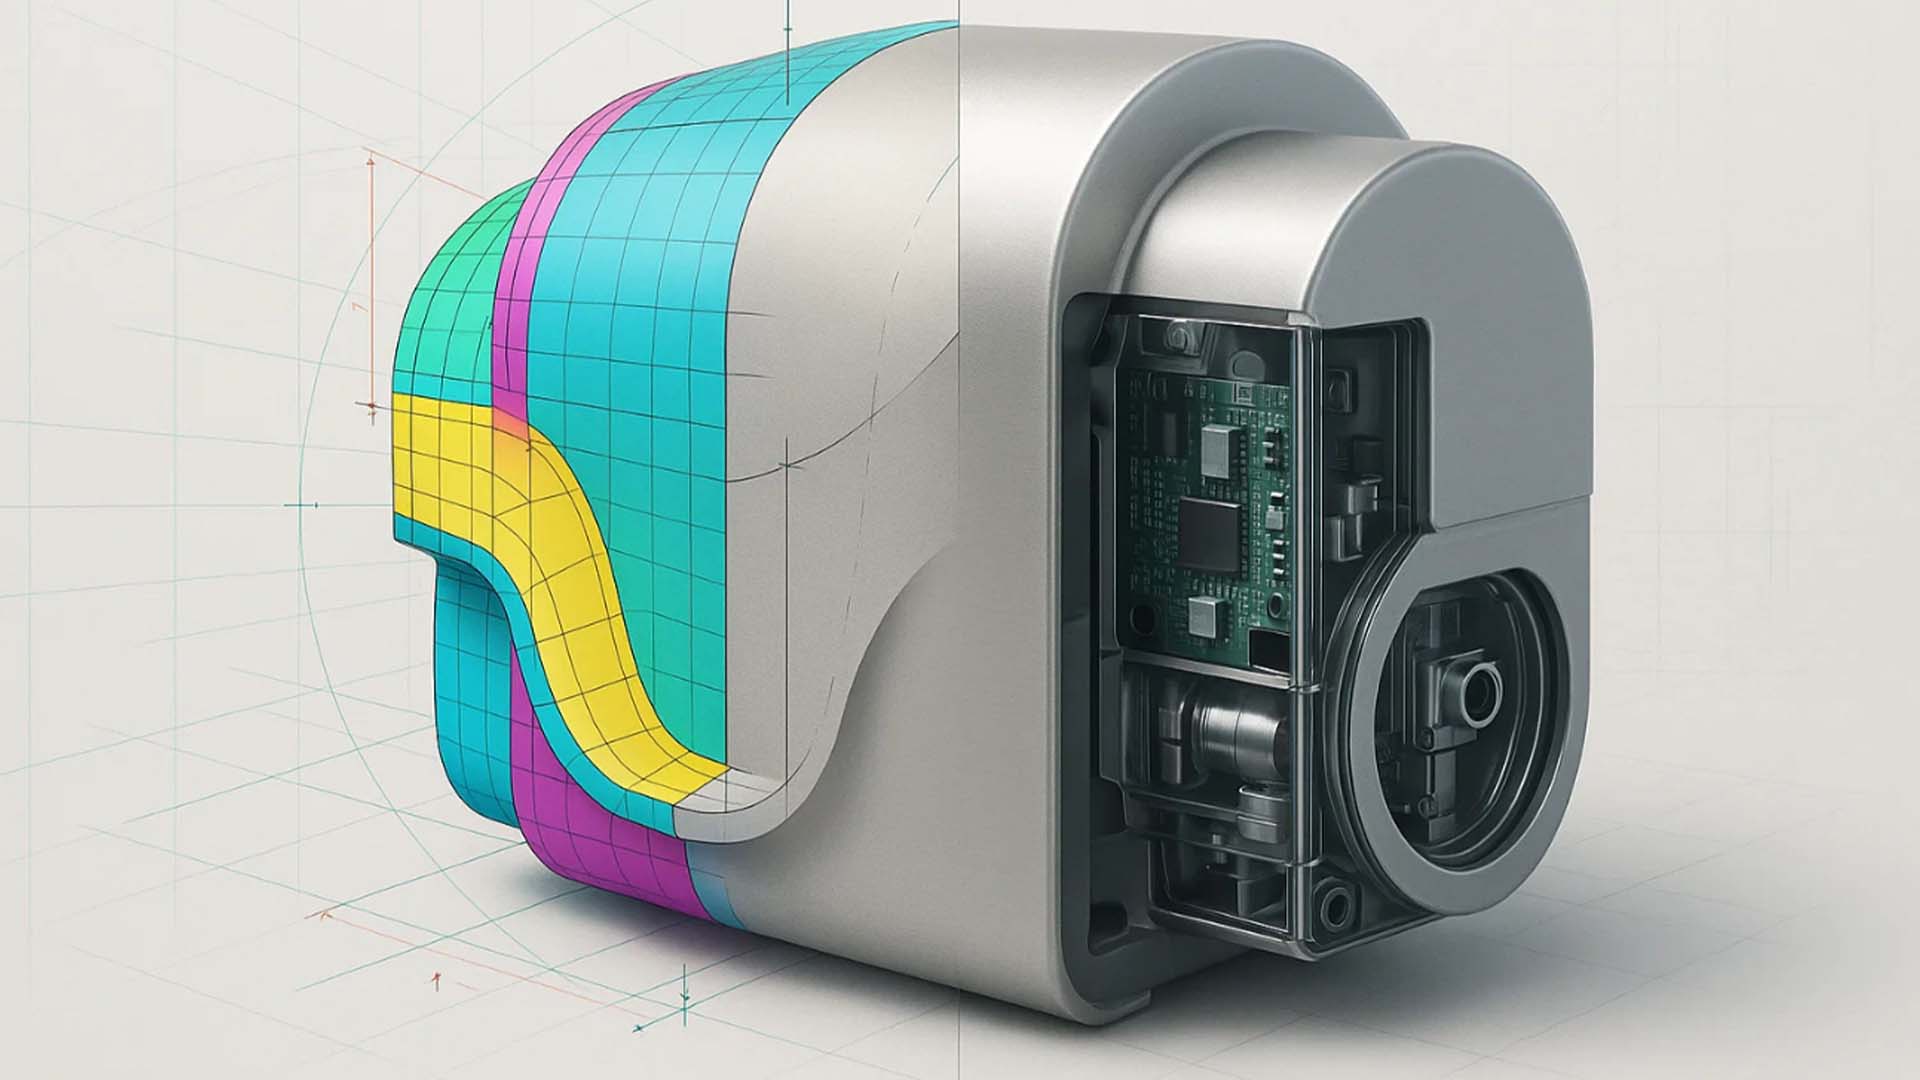
From CAD model to photorealistic staging: The same geometry remains technically accurate, while materials, transparency, and lighting behavior create a realistic product representation.
How visual assets emerge from CAD data

The visualization pipeline: From precise CAD construction data through data preparation and material definition to versatile visual assets for documentation, XR, simulation, and marketing.
Real-time engines as the new control center of visualization
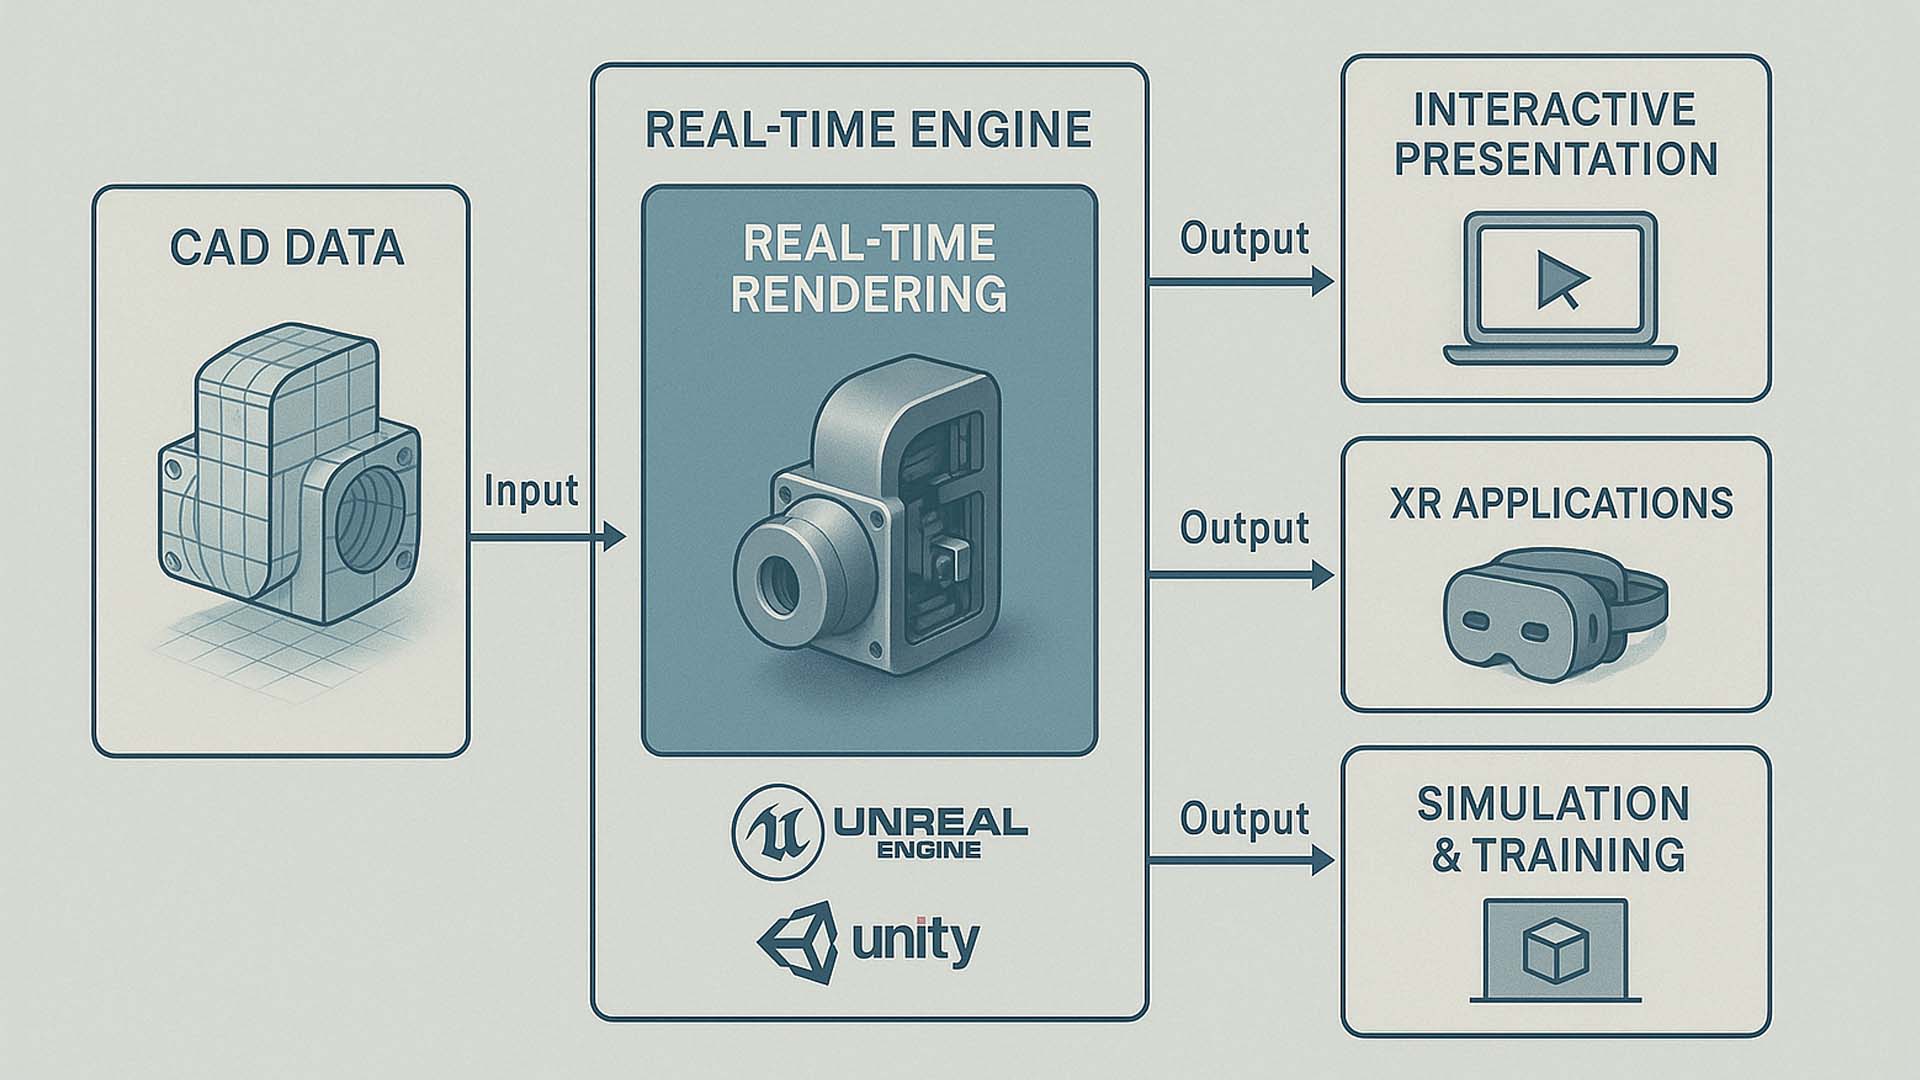
Real-time visualization as a system architecture: CAD data flows into a game engine, is rendered photorealistically in real time, and becomes usable for interactive applications, XR scenarios, and scalable product communication.
When artificial intelligence takes over visual decisions

AI-augmented real-time visualization: An AI layer interprets precise CAD data and generates context-aware visual variants for marketing, XR, simulation, and digital twins, all from a single model.
When visualization becomes interaction
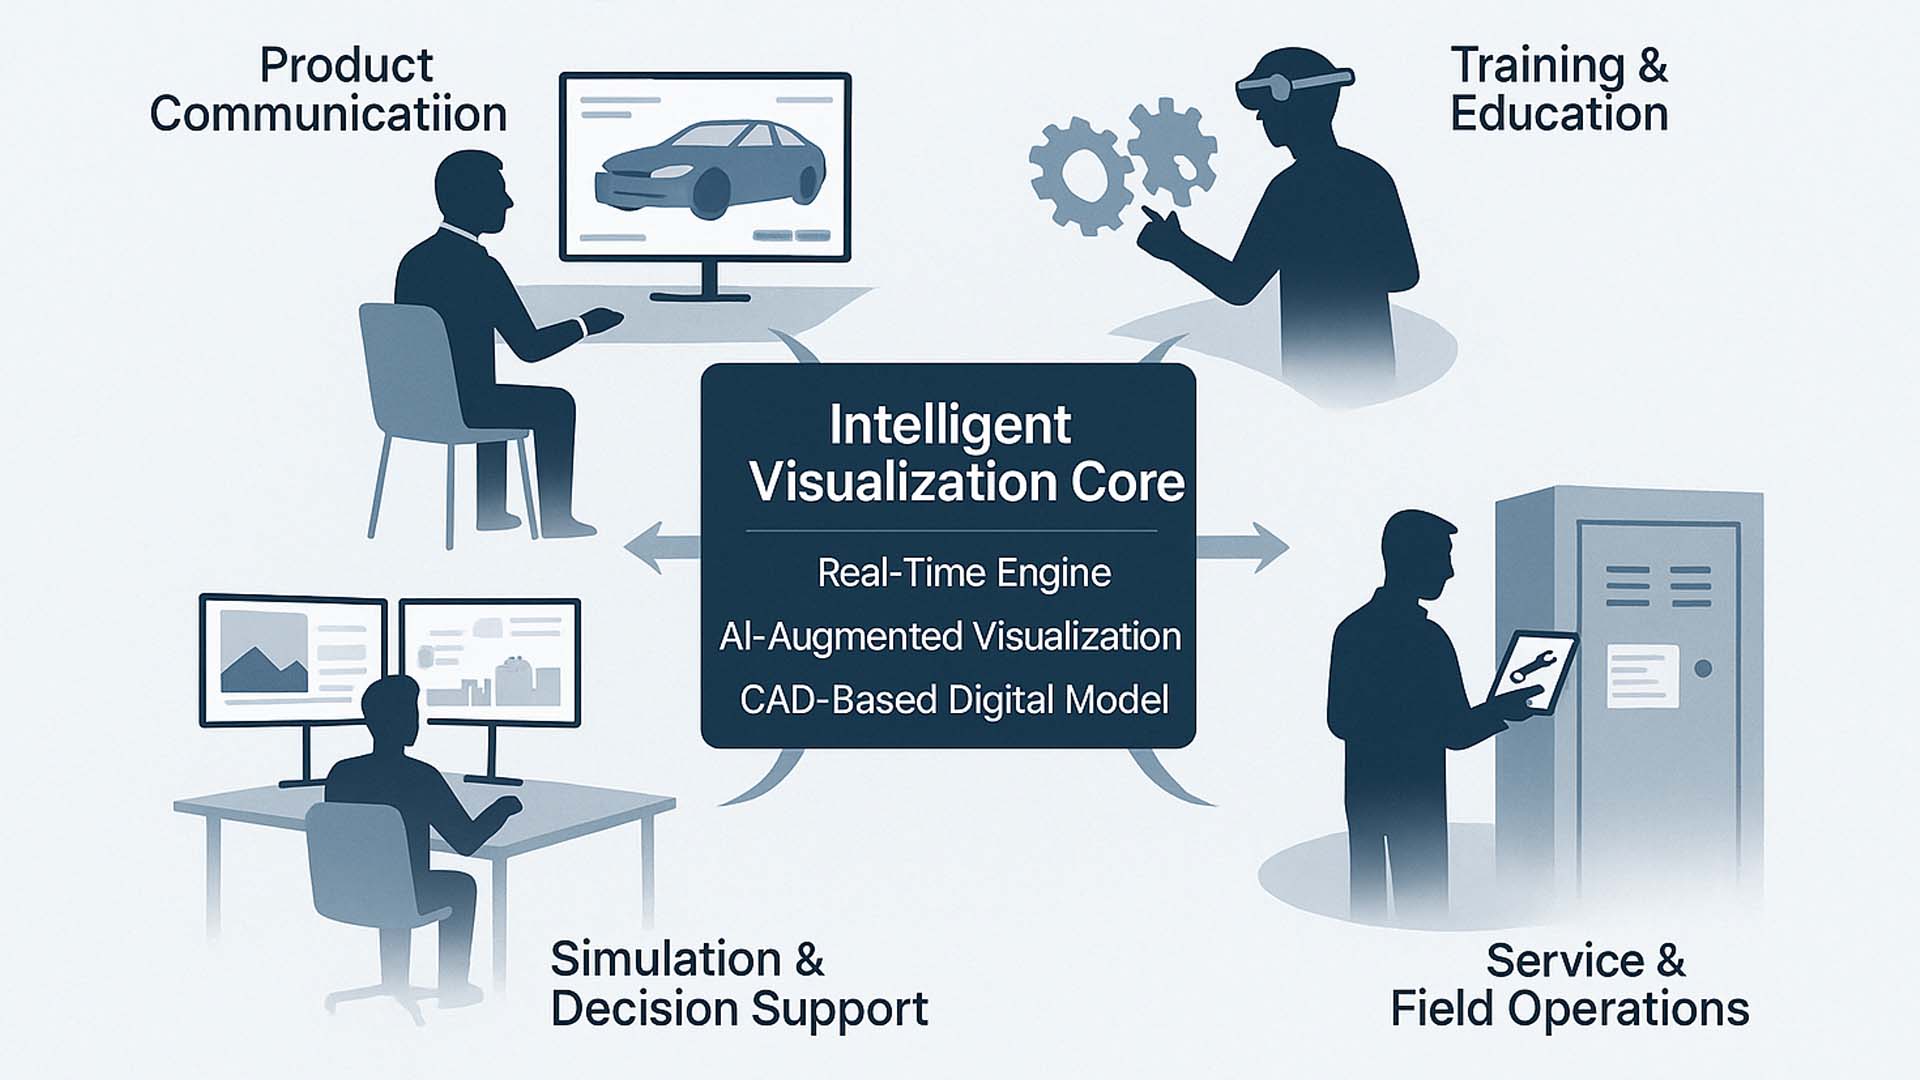
Intelligent visualization systems connect CAD data, AI, and real-time engines into interactive usage scenarios for communication, training, service, and decision support.
From construction data to visual reality
Modern product visualization begins with precise construction data and unfolds its impact through real-time rendering and AI-driven interpretation.
The VISORIC expert team in Munich
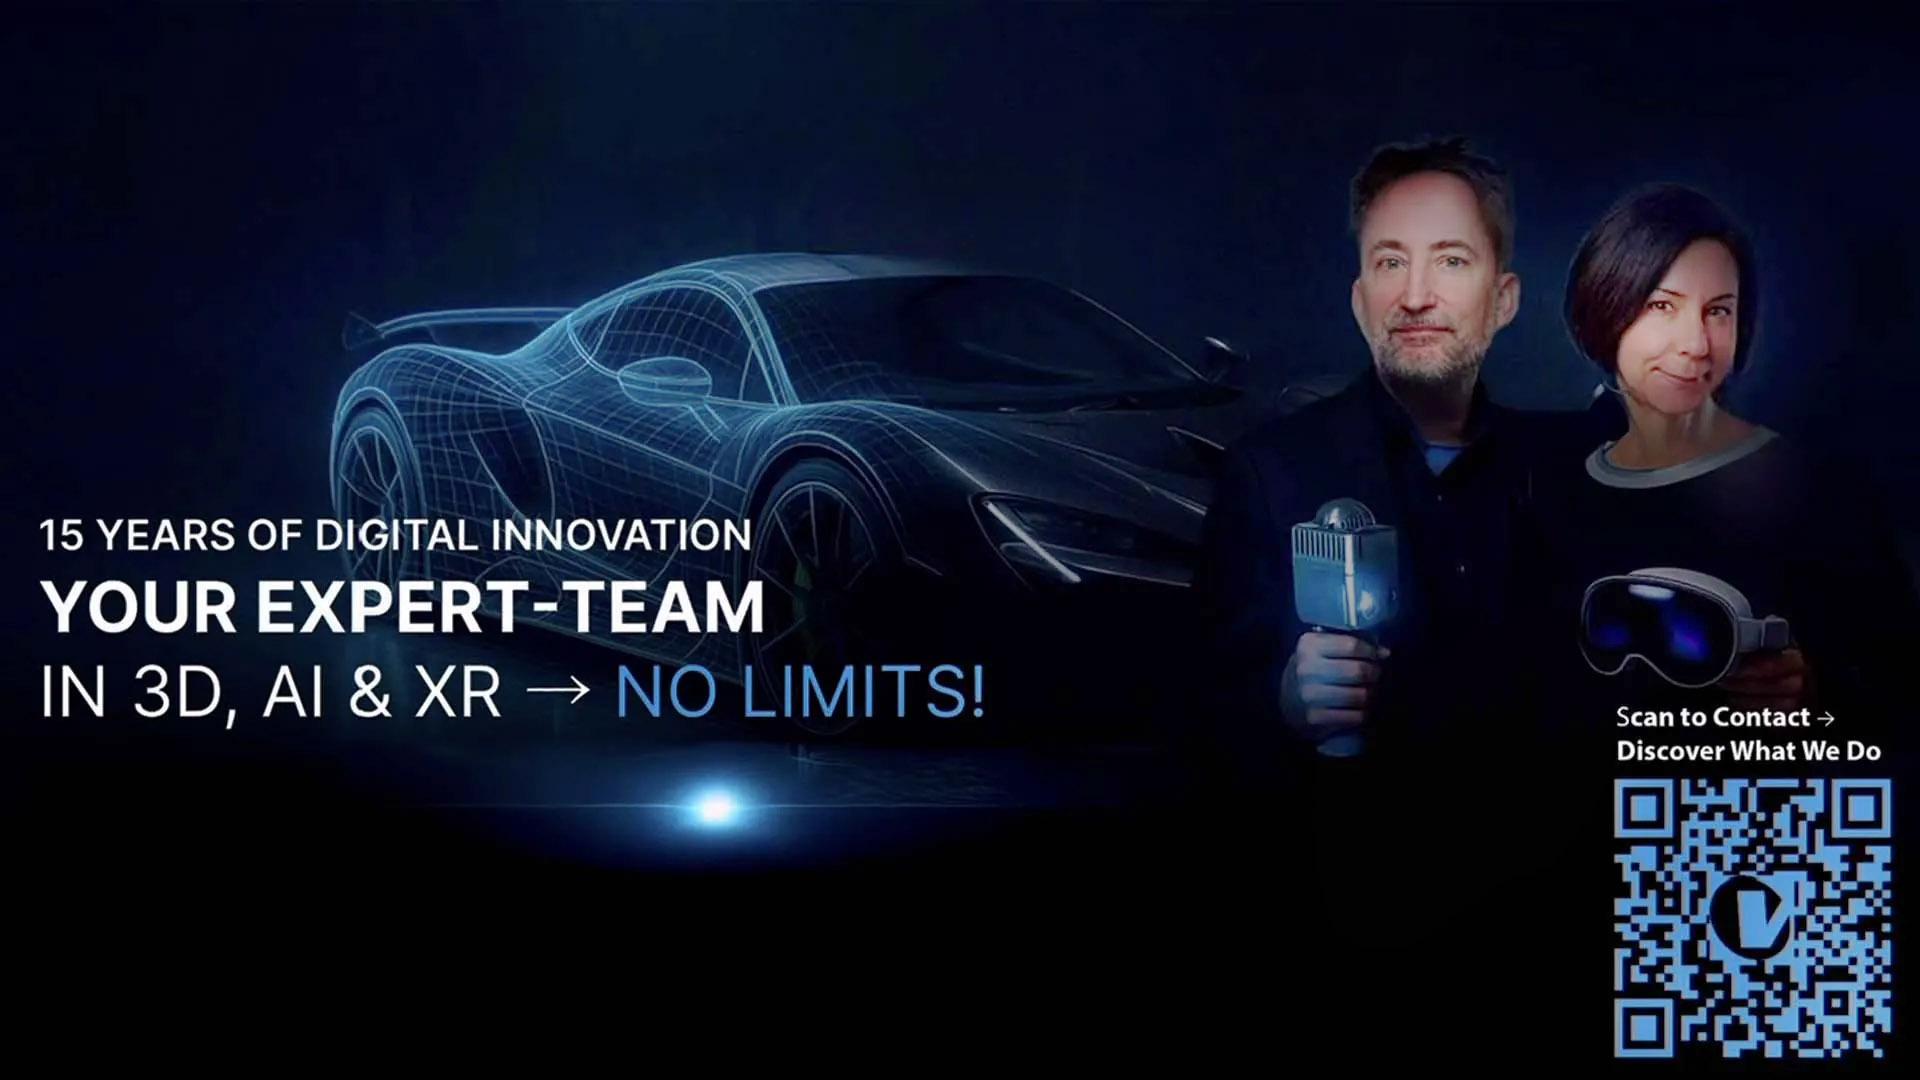
The VISORIC expert team: Ulrich Buckenlei and Nataliya Daniltseva discussing CAD data preparation, photorealistic visualization, and real-time pipelines.
Phone: +49 89 21552678
Ulrich Buckenlei (Creative Director)
Mobil +49 152 53532871
Mail: ulrich.buckenlei@xrstager.com
Mobil + 49 176 72805705
Mail: nataliya.daniltseva@xrstager.com
VISORIC GmbH
Bayerstraße 13
D-80335 Munich