

Precision as a brand promise: surveying technology behind a digital grid mesh.
Photo: © Ulrich Buckenlei, INTERGEO 2026 Munich | XR Stager Online Magazine | VISORIC GmbH
On stage at INTERGEO 2026 in Munich, Konrad Wenzel, CTO for Digital Twins at Esri, shows a map section of the Netherlands captured from the air that still reveals individual manhole covers and traffic signs. The underlying dataset currently runs at roughly three centimeters ground resolution, the stated target is 2.5 centimeters, to be refreshed every year going forward.[1]
What looks at first glance like a technical demonstration is actually evidence of a bigger shift in the geodesy and spatial computing industry: Gaussian Splatting is leaving behind its role as impressive visualization and becoming a data layer you can measure, plan, and manage with. INTERGEO 2026 dedicated its technical program explicitly to topics like 3D reconstruction, urban twins, and interoperability between 3D methods, a clear signal for where the whole industry is heading.[2]
- Esri and Dutch partner Kavel 10 are mapping the entire area of the Netherlands in 3D.
- Current ground resolution is roughly three centimeters, the target is 2.5 centimeters.
- The dataset is meant to be updated annually going forward.
- Gaussian splats are georeferenced in the process and become directly measurable within GIS systems.
- At the same time, Esri itself warns against equating a realistic 3D model with a digital twin.
This article breaks down what was actually new at INTERGEO 2026, how the underlying technology works, which boundary question Esri itself raises openly, and what this means for companies beyond geodesy.
The Stage in Munich. What Esri Actually Showed at INTERGEO 2026
I was on site as an accredited journalist and recorded and analyzed Wenzel’s talk myself. His point deliberately went beyond image quality alone: Gaussian splats, as he argued, are becoming georeferenced, measurable, and directly usable within GIS environments. That’s a technical difference with a practical consequence, because a dataset that just looks good is fit for a presentation. A dataset that can be measured and is linked to coordinate systems is fit for a decision.
Research shows that the underlying partnership between Esri Nederland and Kavel 10 was already publicly introduced in spring 2026.[3] Wenzel’s appearance in Munich was therefore not a first announcement, but the presentation of the next expansion stage of an already running program, with a new, more concrete target resolution of 2.5 centimeters.
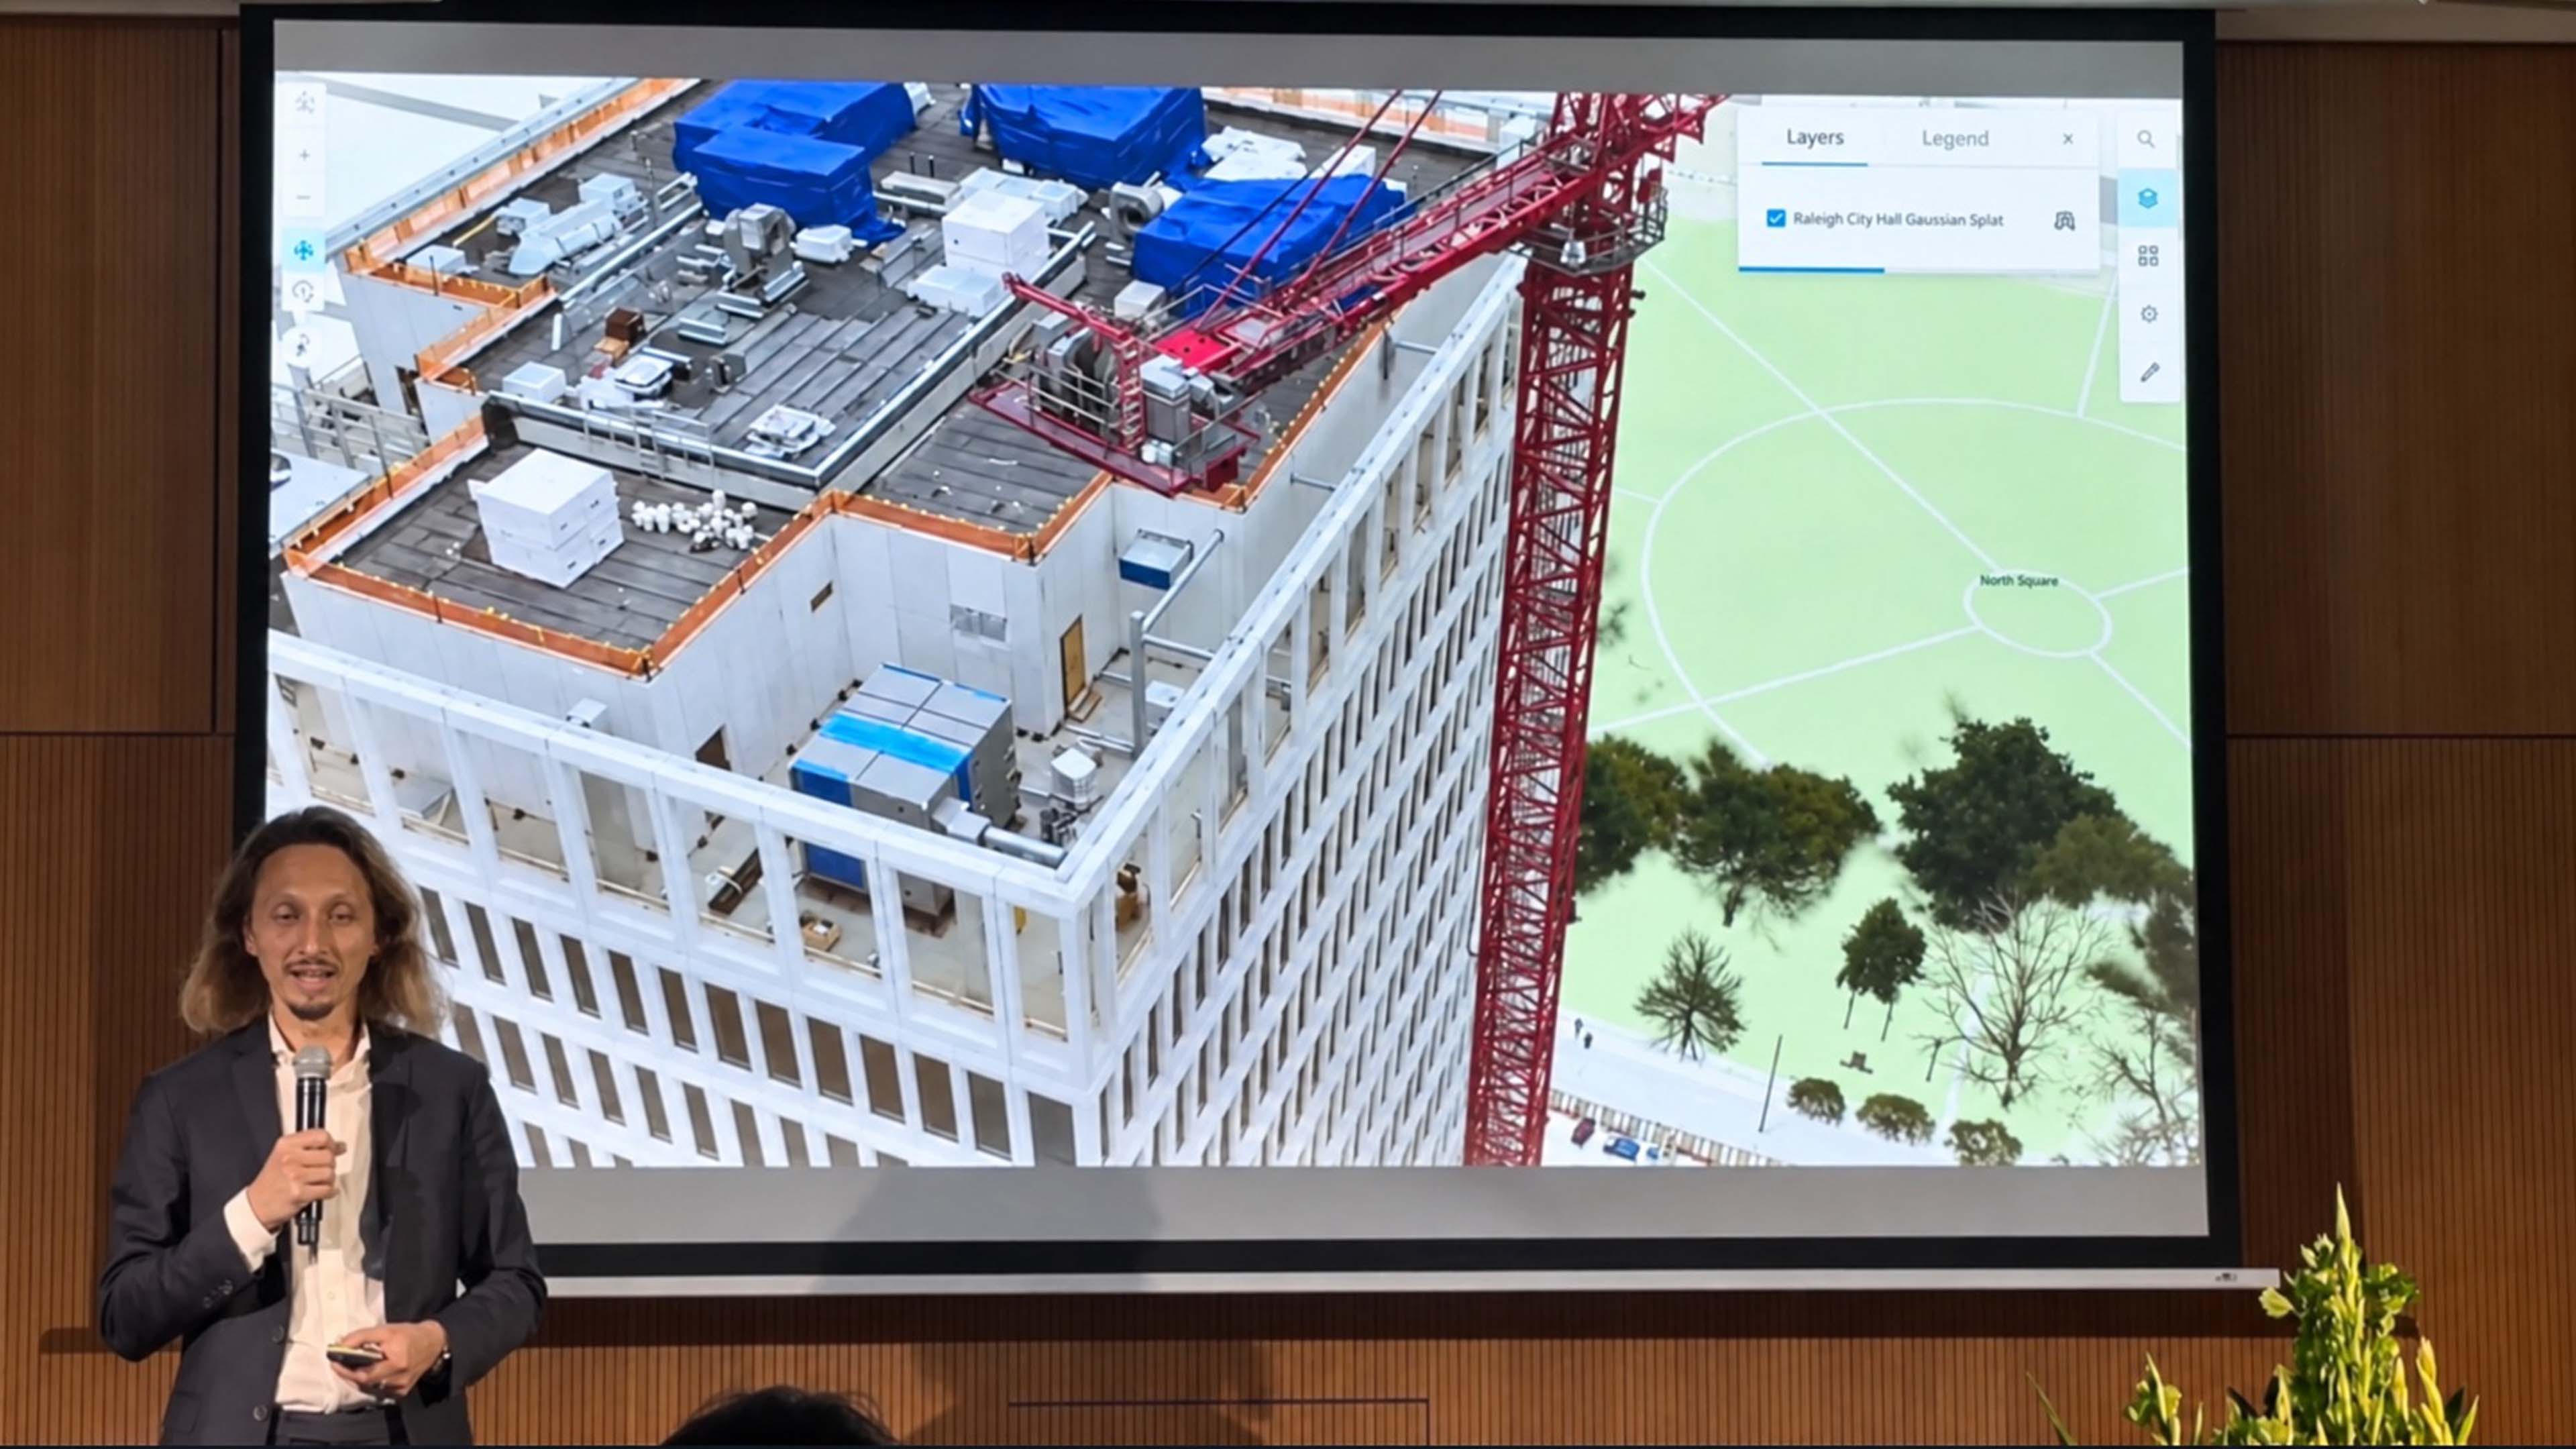
Not a first announcement, but the next expansion stage of an ongoing program.
Photo: Konrad Wenzel, CTO Digital Twin at Esri, at INTERGEO 2026 in Munich | Photo: © Ulrich Buckenlei | XR Stager Online Magazine | VISORIC GmbH
That already gives us a first takeaway: what was genuinely new in Munich wasn’t the existence of the dataset, but the clear framing Wenzel used to name the difference between a realistic 3D image and a usable geospatial data infrastructure.
- Konrad Wenzel is CTO for Digital Twins at Esri.
- The Esri Nederland / Kavel 10 partnership already launched in spring 2026.
- What was new in Munich was the concretized target resolution of 2.5 centimeters.
- INTERGEO 2026 dedicated its technical program specifically to 3D reconstruction and urban twins.
- Wenzel’s central claim: Gaussian splats are becoming georeferenced and measurable.
To assess that claim, it’s worth first taking a look at the technology itself behind the term Gaussian Splatting.
Gaussian Splatting Explained. From Single Photo to Measurable Point Cloud
Gaussian Splatting computes a three-dimensional model from millions of individual photos by representing the scene not as a rigid polygon mesh, but as a cloud of millions of small, soft points of color and brightness, so-called Gaussians. Each of these points carries information about position, shape, color, and transparency. Together, they produce an image that looks photorealistic from any viewing angle and, unlike classical 3D meshes, can be computed and rendered significantly faster.[4]
The decisive difference from pure visualization, however, lies not in the visuals but in whether this point cloud can be embedded into a geographic coordinate system. That’s exactly the step Esri has taken by integrating it into ArcGIS: an impressive view becomes a data layer that can be linked to distances, areas, and real-world objects.
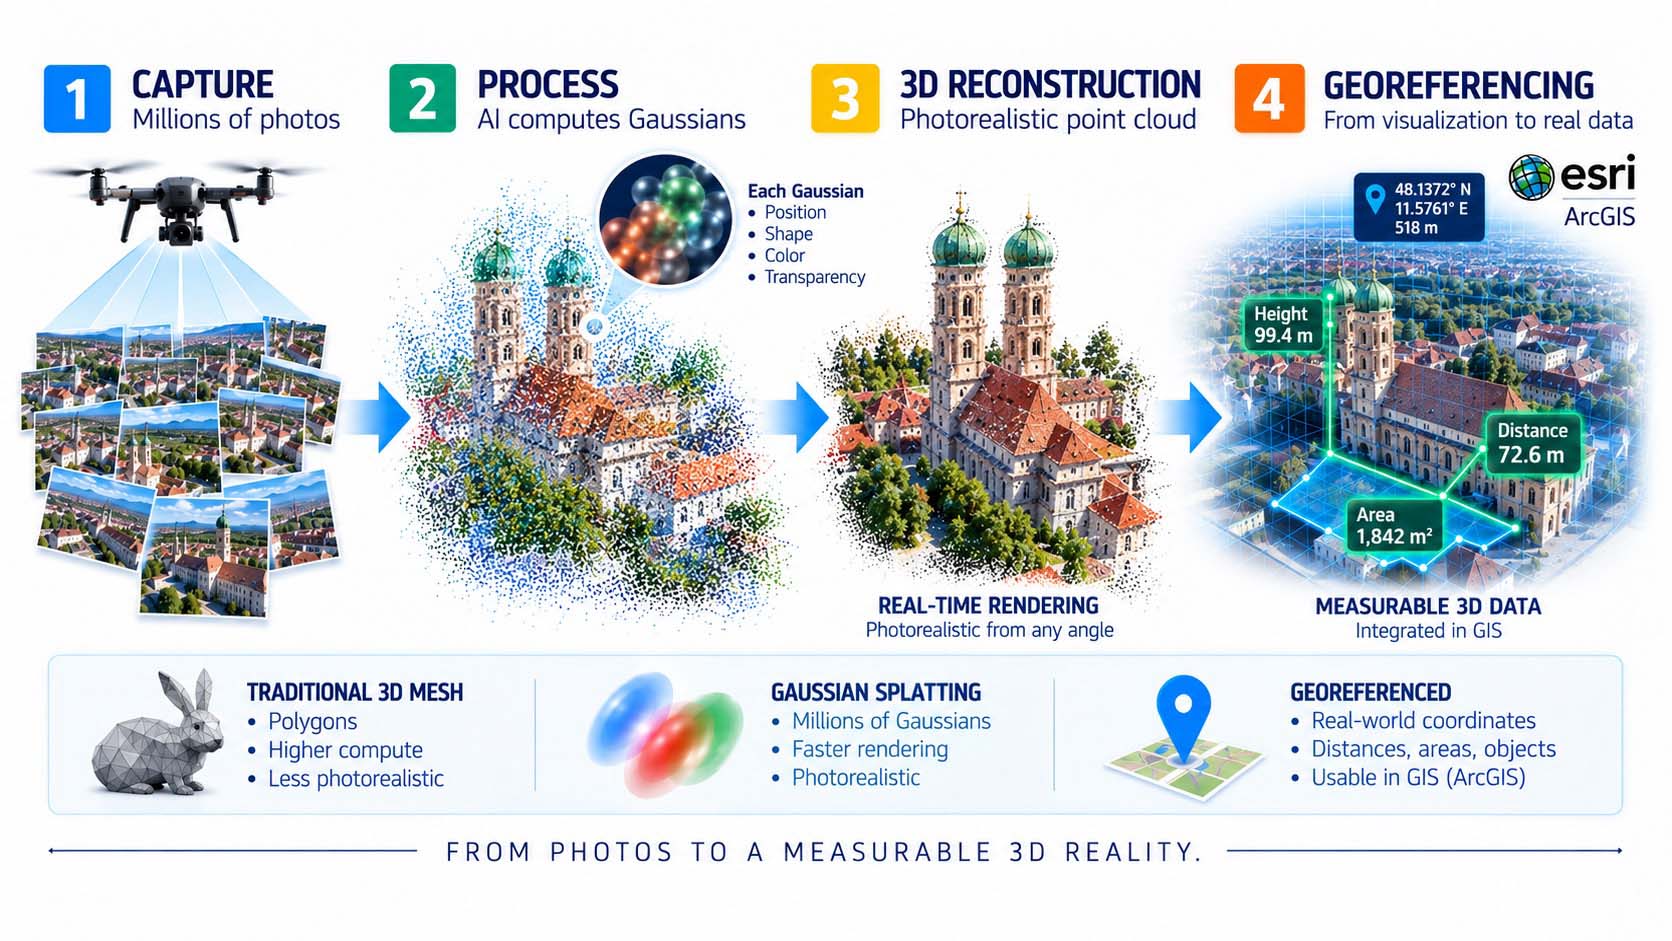
The leap isn’t in the visuals, it’s in the embedding into a coordinate system.
Infographic: From aerial imagery to a georeferenced Gaussian Splatting model | Graphic: © Ulrich Buckenlei | XR Stager Online Magazine | VISORIC GmbH
For assessing Wenzel’s talk, that means: the technical foundation of Gaussian Splatting has existed for a few years already. What’s new is that it’s now being georeferenced at large scale, and thereby pulled out of the pure-visualization corner.
- Gaussian Splatting uses millions of individual color and brightness points instead of a rigid 3D mesh.
- The method computes and renders scenes significantly faster than classical meshes.
- Photorealism alone doesn’t make a model georeferenced.
- Only embedding it into a coordinate system makes the point cloud measurable.
- Esri has implemented exactly this integration step in ArcGIS.
How important this distinction is becomes especially clear with a term Esri itself explicitly corrects in its own technical articles: the digital twin.
Realistic Isn’t the Same as Alive. Why a 3D Model Still Isn’t a Digital Twin
In its own technical articles, Esri explicitly warns against an equation that’s commonly seen across the industry: a 3D mesh or a Gaussian Splatting model quickly gets labeled a “digital twin” just because it looks realistic. In reality, a reality-mapping product is initially a snapshot at a given point in time. A digital twin, by contrast, is a connected, continuously updating representation that incorporates live data, rules, and analytical functions to support decisions.[5]
Reality-mapping outputs such as true orthos, point clouds, 3D meshes, or indeed Gaussian splats are therefore not the digital twin itself, but its visual foundation, often the most credible one a twin can have.
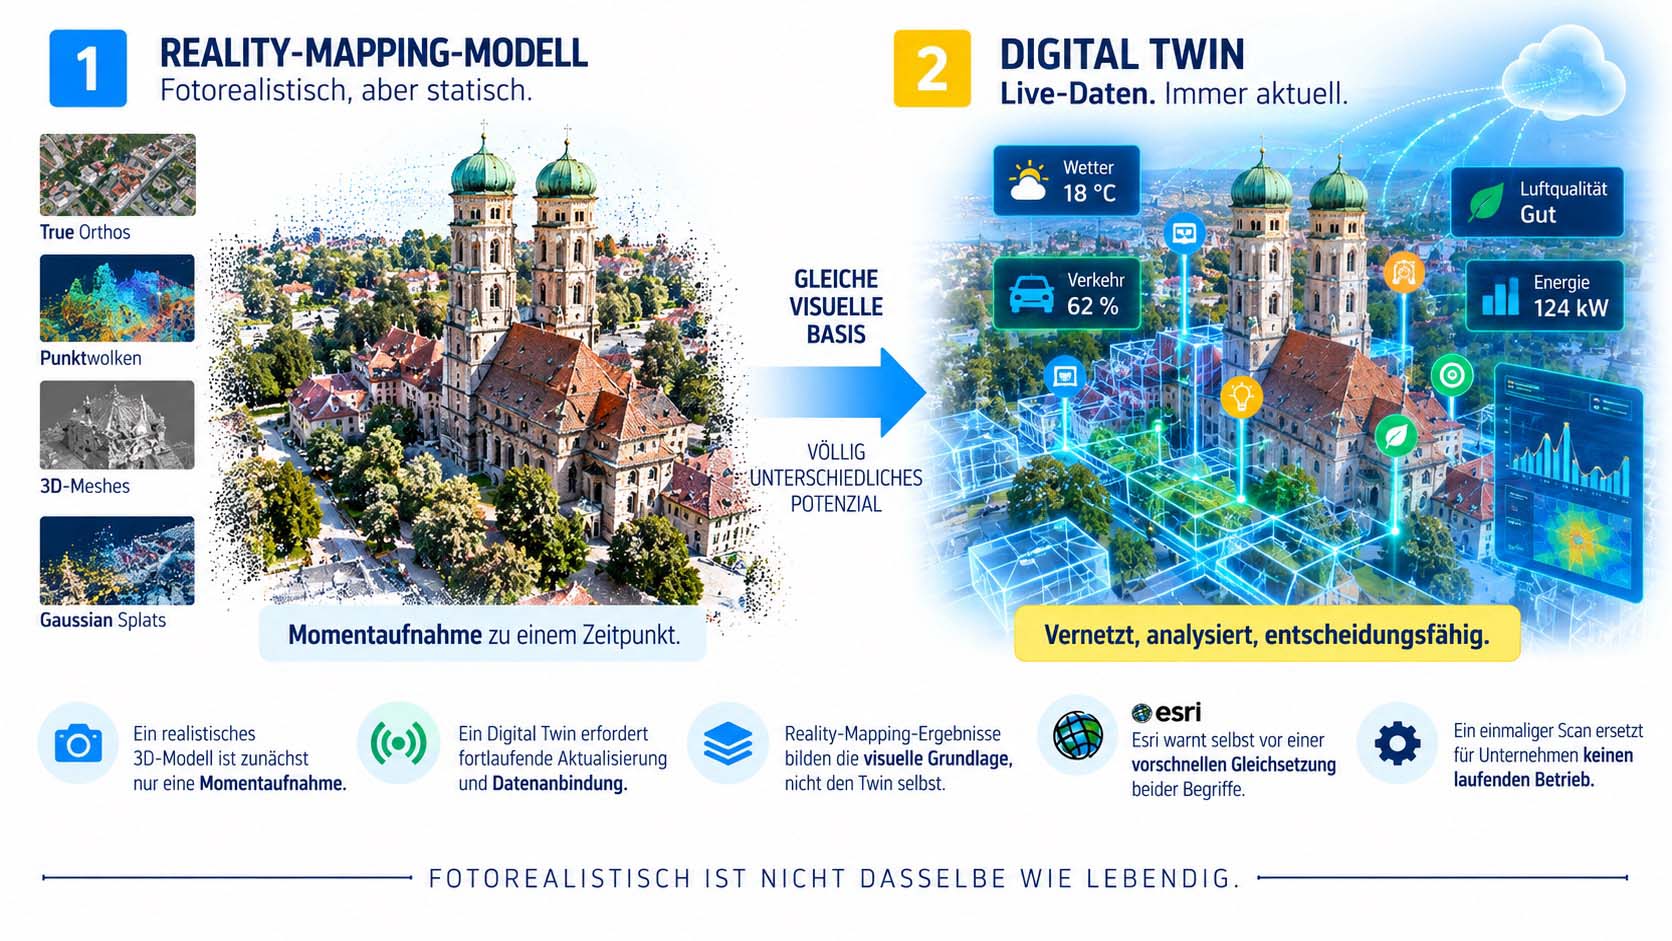
Photorealistic isn’t the same as alive.
Infographic: Static 3D model compared to a live-updated digital twin | Graphic: © Ulrich Buckenlei | XR Stager Online Magazine | VISORIC GmbH
| Characteristic | Reality Mapping Model | Digital Twin |
|---|---|---|
| Nature | Snapshot at one point in time | Continuously updated representation |
| Data connection | Visual, static | Linked to live and sensor data |
| Function | Visual foundation / reference image | Operational decision basis |
The difference isn’t in the visuals, it’s in the currency of the data.
Table: Reality mapping model compared to a digital twin | Source: Esri ArcGIS Blog | © Ulrich Buckenlei | XR Stager Online Magazine | VISORIC GmbH
For companies considering building their own digital twin, this distinction isn’t an academic footnote, it’s an expectation correction: a one-off, however impressive, 3D scan doesn’t replace an ongoing operation.
- A realistic 3D model is initially just a snapshot.
- A digital twin requires continuous updates and data connectivity.
- Reality-mapping outputs form the visual foundation, not the twin itself.
- Esri itself warns against too quickly equating the two terms.
- For companies, that means: a one-time scan doesn’t replace ongoing operation.
What this distinction looks like in a concrete case is shown by the actual Netherlands dataset Wenzel presented on stage.
The Real-World Case. How the Netherlands Is Being Built at 2.5 Centimeters
The technical foundation of the example shown is a partnership between Esri Nederland and Kavel 10, a Dutch provider of aerial imagery and lidar data. Kavel 10 had already invested in early 2026 in three large-format aerial cameras of the UltraCam Osprey 4.2 type, in order to capture the entire national territory at a ground resolution of roughly three centimeters, combined with the corresponding UltraMap processing chain for orthophotos and 3D meshes.[6]
This infrastructure produced the ArcGIS data package that gives users direct access to high-resolution, annually updated 3D data of the Netherlands, without organizations having to handle their own capture or processing. Esri and Kavel 10 explicitly position the offering for topics such as the energy transition, climate adaptation, and the redesign of public space.
From an entire country down to a single manhole cover, with no break in resolution.
Infographic: Coverage and resolution of the Netherlands dataset | Graphic: © Ulrich Buckenlei | XR Stager Online Magazine | VISORIC GmbH
| Metric | As of Spring 2026 | Target per INTERGEO Talk |
|---|---|---|
| Ground resolution | approx. 3 cm | 2.5 cm |
| Coverage area | Entire Netherlands | Entire Netherlands |
| Update cycle | One-time data package | Annual |
From a one-off capture to an annually maintained data product.
Table: Evolution of the Netherlands dataset’s key metrics | Source: GIM International, Vexcel Imaging Newsroom | © Ulrich Buckenlei | XR Stager Online Magazine | VISORIC GmbH
Wenzel’s figure of 2.5 centimeters thus describes the next expansion stage of an already running program, not its starting point.
- Kavel 10 invested in three UltraCam Osprey 4.2 camera systems in early 2026.
- Current ground resolution is roughly three centimeters.
- The target is 2.5 centimeters resolution with annual updates.
- The data package is directly usable via ArcGIS, with no need for in-house capture.
- It’s positioned for the energy transition, climate adaptation, and urban planning.
That raises the follow-up question of what this level of accuracy actually enables in practical use, beyond the map view itself.
From View to Measurement Basis. What GIS Integration Actually Means
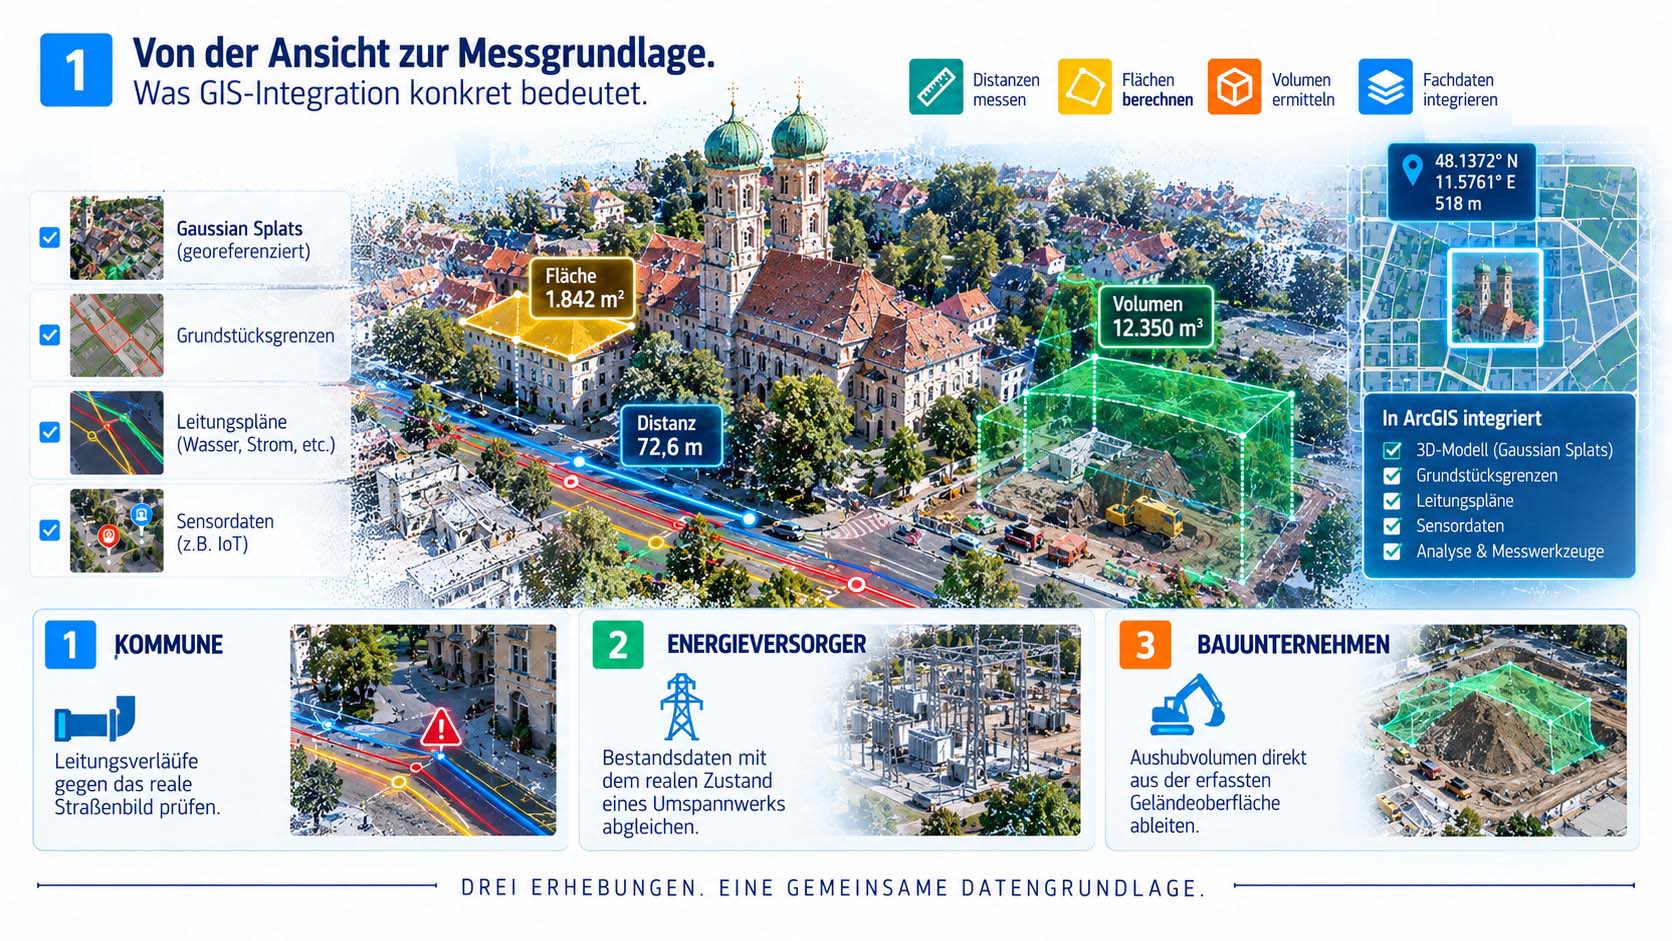
The practical difference only shows up in the details. Once a Gaussian Splatting model is embedded in a GIS coordinate system, distances, areas, and volumes can be calculated directly within it. Property boundaries, pipeline plans, or sensor data can be laid directly over the captured reality, instead of existing side by side in separate systems.
That changes what such a dataset can actually be used for. A municipality can check whether a planned pipeline route collides with the real street layout. A utility company can compare existing records against the real condition of a substation. A construction company can derive excavation volumes directly from the captured terrain surface.
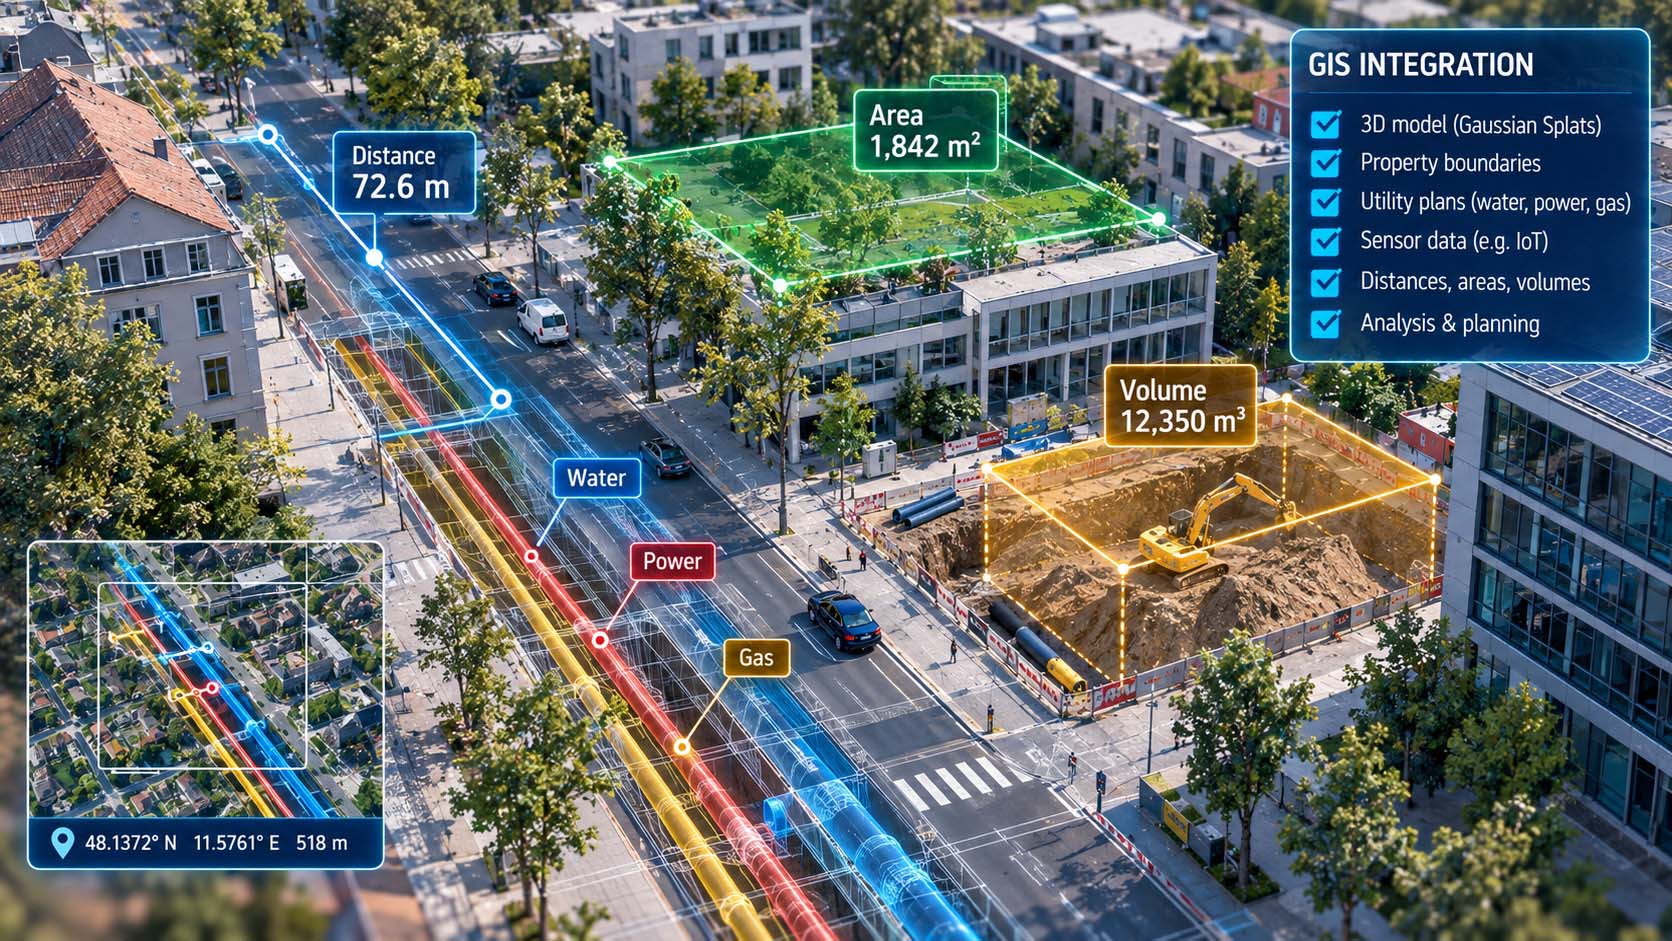
Three separate surveys become one shared data foundation.
Infographic: Measurement functions of a georeferenced Gaussian Splatting model | Graphic: © Ulrich Buckenlei | XR Stager Online Magazine | VISORIC GmbH
In all three examples, the georeferenced 3D capture replaces several separate surveys with one shared, current data foundation that multiple departments can use at the same time.
- Georeferenced models allow direct distance, area, and volume calculation.
- Pipeline plans and sensor data can be laid directly over the capture.
- Municipalities can check pipeline routes against the real street layout.
- Construction companies can derive excavation volumes directly from the terrain surface.
- A shared data foundation replaces multiple separate individual surveys.
This very depth of detail, however, raises a question Wenzel himself did not shy away from on stage.
The Flip Side. Who Gets to See a Country in Centimeters?
Wenzel didn’t stop at the technical success story on stage. He explicitly pointed out that German data protection officers were likely to develop their own views on such an undertaking. Once an entire country exists as an annually updated, centimeter-accurate 3D model, the central question shifts: it’s no longer just about what’s technically capturable, but about who gets access at which level of detail, under what conditions, and for what purpose.[7]
This framing is notable because it comes from the technology side itself, not from outside critics. A resolution that distinguishes individual manhole covers and traffic signs also, by the same token, makes private properties, driveways, and building details visible with a sharpness that used to be reserved for individual, targeted photographs.
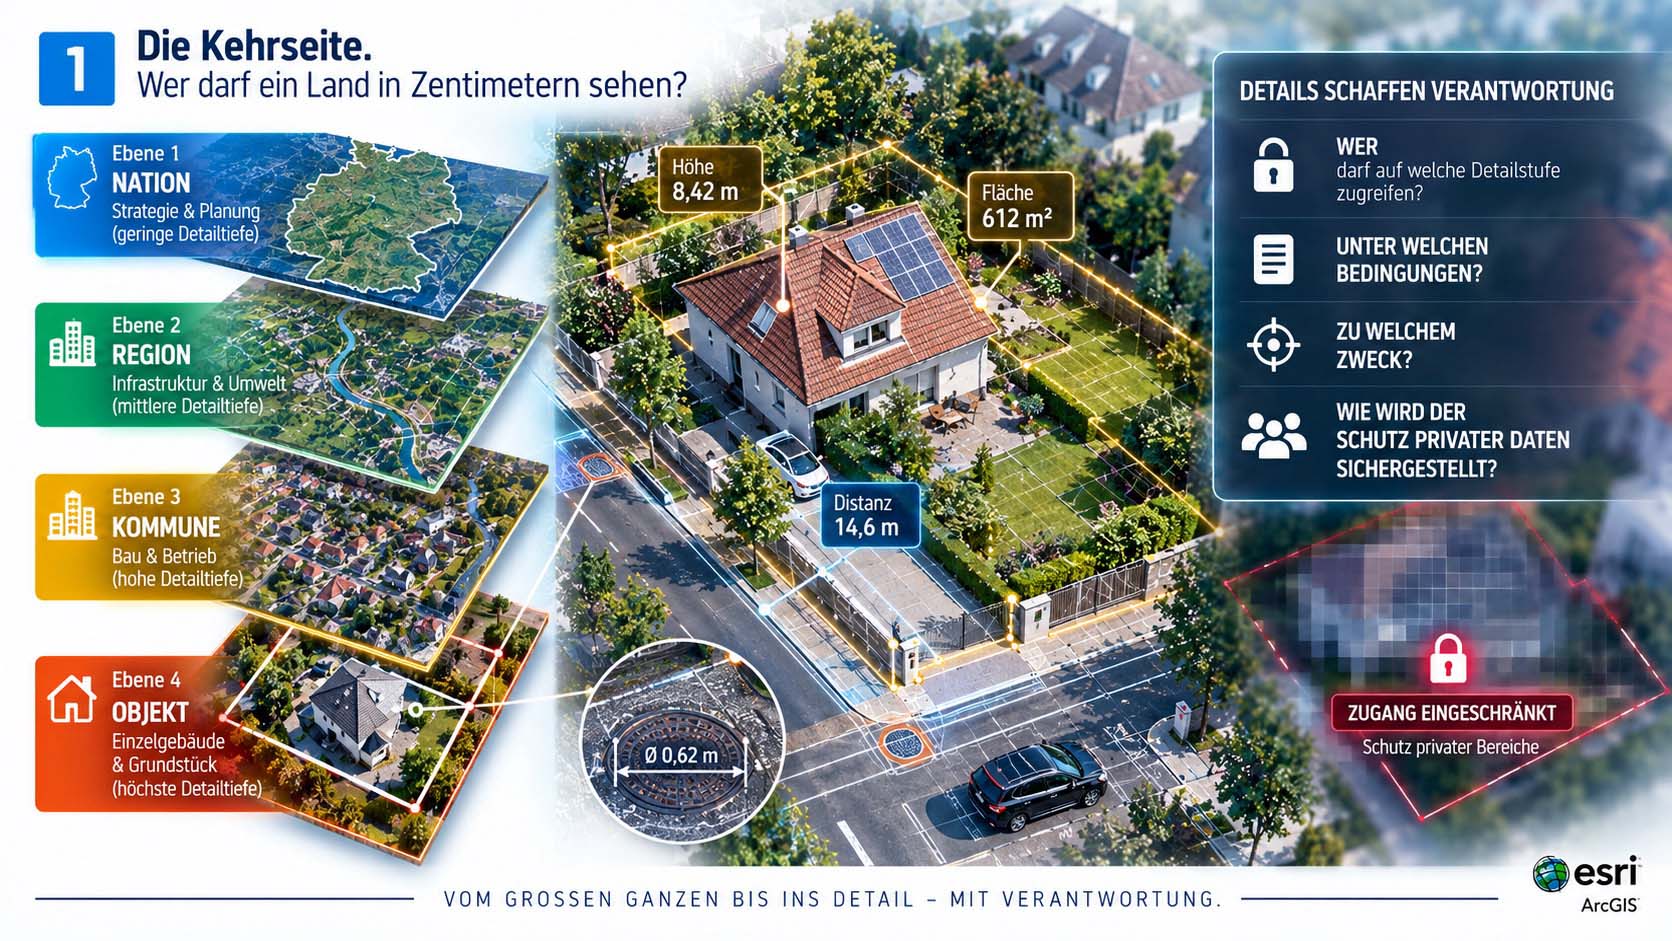
No longer just what’s capturable, but who gets access to what.
Infographic: Possible access levels for a nationwide 3D dataset | Graphic: © Ulrich Buckenlei | XR Stager Online Magazine | VISORIC GmbH
For a nationwide, annually updated dataset, this raises a governance question that goes beyond classical aerial-imagery regulation, and one that hasn’t yet been conclusively answered in public.
- Wenzel actively raises the data protection dimension himself, on stage.
- The central question going forward is access, not mere capturability.
- Centimeter-accurate resolution also makes private details widely visible.
- Annual updates sharpen the question of permanent access control.
- A conclusive governance solution is still publicly outstanding.
From this fundamental question, it’s worth looking at what this development practically means for companies beyond the geodesy industry itself.
What This Means for Companies Beyond Geodesy
Even those not working in surveying are affected by this development, as soon as physical sites, assets, or infrastructure are part of their business. Urban planning, grid operations, construction, and facility management gain, for the first time, a shared, highly current foundation in georeferenced Gaussian Splatting data, one different departments can work on without each commissioning their own surveys.
The economic core of this lies less in the spectacular image and more in the reusability of the data. A 3D model captured once, georeferenced, can simultaneously serve planning, documentation, condition comparison, and communication, instead of requiring a separate capture for each purpose.
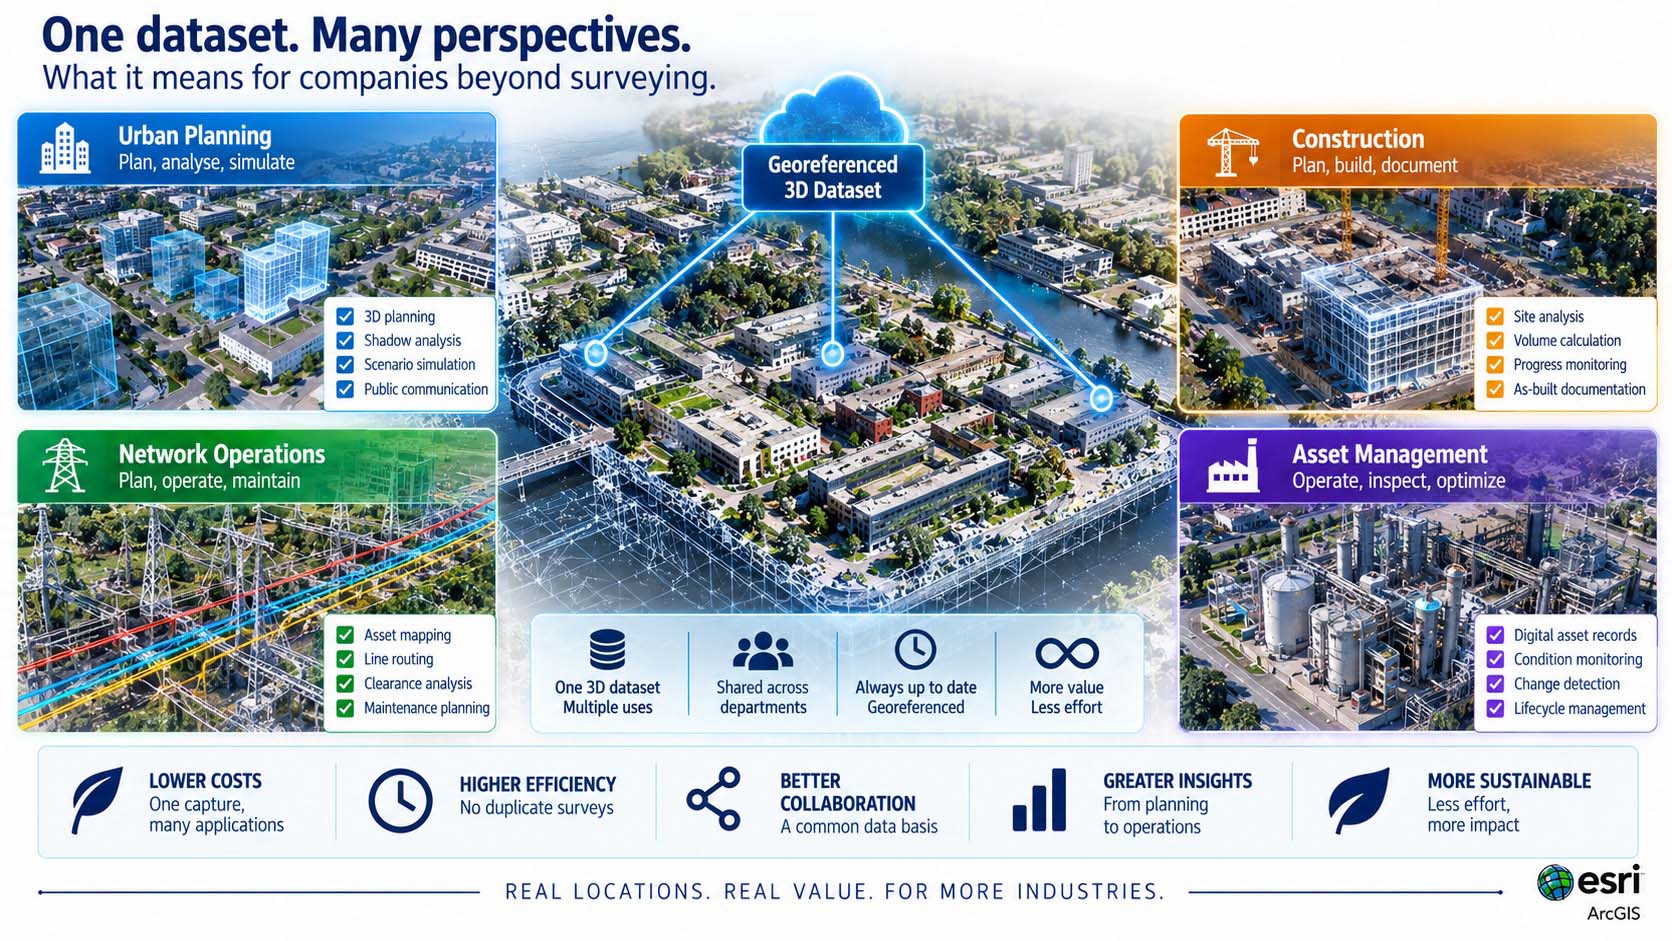
One data foundation, four departments, no duplicated effort.
Infographic: Shared use of a georeferenced 3D dataset across departments | Graphic: © Ulrich Buckenlei | XR Stager Online Magazine | VISORIC GmbH
This is exactly the transition this article’s title also describes: from an impressive individual scan to a reliable infrastructure layer that multiple departments can build on at once.
- Urban planning, grid operations, construction, and facility management will share one data foundation.
- The economic value lies in reusability, not in the individual image.
- One model can serve planning, documentation, and communication at the same time.
- Repeated surveys for different purposes are increasingly becoming unnecessary.
- The shift from individual scan to infrastructure layer affects many industries.
How this transition is likely to continue over the coming years is the subject of the concluding look beyond the Netherlands.
Outlook. From Individual Buildings to Entire Countries
The Netherlands is currently the most advanced, publicly documented example of nationwide, georeferenced Gaussian Splatting, but hardly an isolated case. INTERGEO 2026 itself dedicated its technical program explicitly to 3D reconstruction, urban twins, and the question of interoperability between different 3D methods, an indication that the entire industry is currently moving from the building and neighborhood level up to the national level.[8]
For the coming years, two developments are likely to continue in parallel: technically, a further increase in resolution alongside falling capture costs, and organizationally, the emergence of access and governance models, as Wenzel already hinted at in Munich.
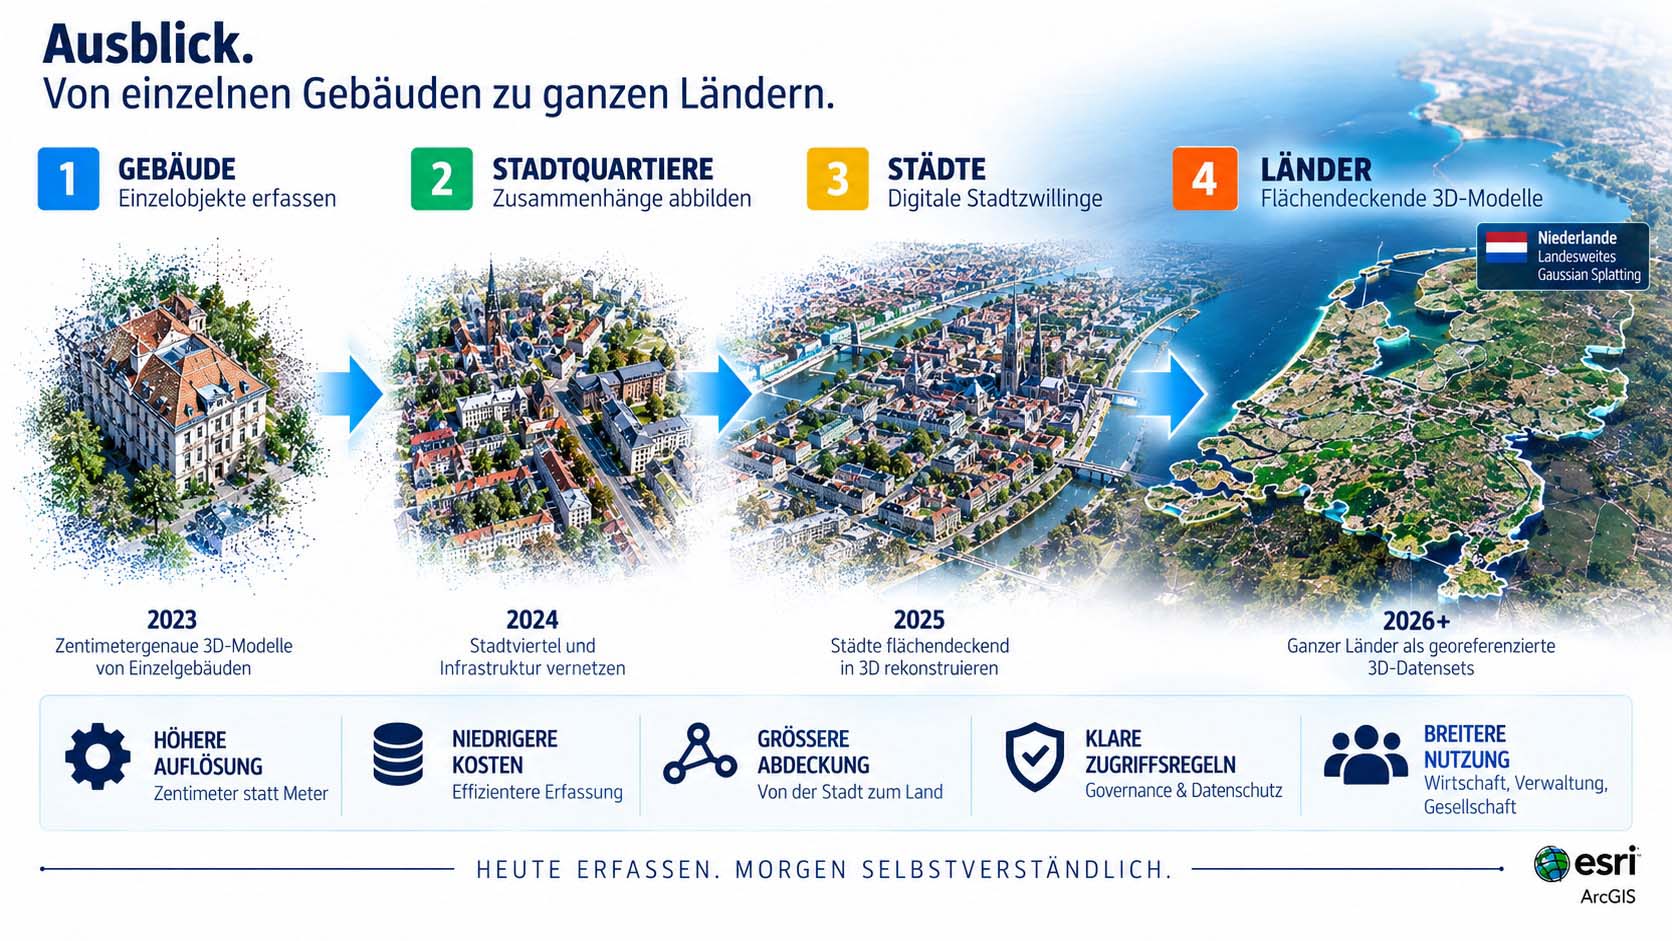
From a single building to an entire country, in just a few years.
Infographic: Development stages of Gaussian Splatting by capture scale | Graphic: © Ulrich Buckenlei | XR Stager Online Magazine | VISORIC GmbH
Any company or municipality starting with 3D capture today is building toward a data infrastructure that, within a few years, could be taken for granted the way a digital site plan is today.
- The Netherlands is the most documented example, not the only case.
- INTERGEO 2026 dedicated its technical program specifically to this transition.
- Capture costs are falling as resolution and coverage area grow.
- Governance and access models are emerging alongside technical maturity.
- Those who start today are building toward infrastructure that will soon be taken for granted.
What this moment on the INTERGEO stage actually felt like is shown in the following video from the on-site recording.
The Moment on Stage. When Data Protection Becomes Part of the Product Pitch
The chapters above have shown what was actually new at INTERGEO 2026, how Gaussian Splatting technically works, why a realistic model still isn’t a digital twin, and what governance question arises from a nationwide, centimeter-accurate dataset. How immediately these questions were already raised on stage itself is most vivid in the recording of the talk.
Embedded here is the video of my own recording of Konrad Wenzel’s presentation at INTERGEO 2026 in Munich, in which he introduces the Netherlands dataset and directly raises the data protection dimension himself right afterward.[9]
Video: Konrad Wenzel, CTO Digital Twin at Esri, talk on the Netherlands dataset | Recording and analysis: Ulrich Buckenlei, INTERGEO 2026, Munich | © Ulrich Buckenlei | XR Stager Online Magazine | VISORIC GmbH
The video makes visible what was broken down technically and legally in the previous chapters: the shift from impressive visualization to operational infrastructure automatically brings the access question along with it, not a later add-on, but part of the product pitch itself.
- Video shows the actual stage presentation at INTERGEO 2026 in Munich.
- Wenzel introduces the Netherlands dataset and its target resolution.
- He raises the data protection dimension in the same breath.
- The governance question is therefore part of the product pitch from the outset.
- This pattern can be transferred to other nationwide data projects.
This example makes tangible where georeferenced Gaussian Splatting already stands today, from an impressive individual capture to a debated infrastructure question.
From Market Assessment to Your Own 3D Data Strategy
A solid decision to build your own 3D data foundation doesn’t come from a single trade-show presentation, it comes from the same thoughtful interplay this article has described: a realistic technology assessment, clear access control, and a cleanly scoped pilot application, exactly the combination at the core of VISORIC’s work.
The expert team at VISORIC GmbH in Munich combines over 15 years of experience in 3D, AI, and spatial computing with hands-on experience visualizing industrial digitalization projects, exactly the building blocks that also matter when assessing georeferenced 3D datasets, whether it’s an initial feasibility assessment, a data strategy, or visualizing a possible digital twin scenario.[10] VISORIC helps companies cleanly separate ambition from reality in a digital twin, before capital gets tied up.

15 years of experience in 3D, AI, and XR, the VISORIC expert team from Munich.
Image: © Ulrich Buckenlei | XR Stager Online Magazine | VISORIC GmbH
A well-thought-out pilot project, a single site, a single location, can often be realized much faster and more cost-effectively than many companies expect. VISORIC guides this path from the initial market assessment through visualizing possible digital twin scenarios to a decision-ready proposal for leadership.[11]
- Market and technology assessment for georeferenced 3D datasets.
- 3D visualization of possible digital twin scenarios before the investment decision.
- From the first pilot idea to a solid decision-ready proposal.
That’s exactly where the starting point for a conversation lies: not with a nationwide vision, but with a clearly scoped, quickly implementable first step that shows whether and where building your own 3D data foundation is already worthwhile today.
Want to find out whether and where building your own 3D data foundation is already worthwhile for your company today?
Talk to the VISORIC expert team in Munich about market assessment, feasibility, and visualizing possible digital twin scenarios. Together, we’ll turn your requirements into a solid, realistic decision basis, not another marketing brochure.
Contact:
Email: info@visoric.com
Phone: +49 89 21552678
Sources and References
- Geo Week. Speaker profile, Konrad Wenzel, CTO Digital Twin at Esri.
- GIM International. Intergeo 2026 to spotlight 3D reconstruction, urban twins and interoperability.
- GIM International. Razor-sharp 3D aerial imagery of the Netherlands is now available in ArcGIS.
- Kerbl, Kopanas, Leimkühler, Drettakis. 3D Gaussian Splatting for Real-Time Radiance Field Rendering, arXiv 2023.
- Esri ArcGIS Blog. Reality Mapping isn’t a Digital Twin. It’s the Visual Foundation That Makes One Trustworthy and Keeps It Up to Date, May 26, 2026.
- Vexcel Imaging Newsroom. Kavel 10 Invests in Three UltraCam Osprey 4.2 Systems for Nationwide 3cm Mapping of the Netherlands, January 22, 2026.
- Talk by Konrad Wenzel, INTERGEO 2026 Munich, recorded and analyzed by Ulrich Buckenlei.
- GIM International. Intergeo 2026 to spotlight 3D reconstruction, urban twins and interoperability, July 17, 2026.
- Own recording and analysis: Ulrich Buckenlei, INTERGEO 2026, Munich, talk by Konrad Wenzel.
- VISORIC practice projects in 3D visualization, digital twins, and spatial computing.
- XR Stager platform for real-time 3D, digital twins, and industrial spatial computing applications.
Contact Us:
Email: info@xrstager.com
Phone: +49 89 21552678
Contact Persons:
Ulrich Buckenlei (Creative Director)
Mobil +49 152 53532871
Mail: ulrich.buckenlei@xrstager.com
Nataliya Daniltseva (Projekt Manager)
Mobil + 49 176 72805705
Mail: nataliya.daniltseva@xrstager.com
Address:
VISORIC GmbH
Bayerstraße 13
D-80335 Munich